


The pair managed to retreat from 1.2573 following Trump's comments that deliver a strong selling wave to the US Dollar. A strong resistance can be seen around 1.2551 and eventually, GBP/USD may start to plummet towards the 200 SMA zone at H1 chart. Above that area, the pair could do a rebound in order to resume the bullish bias, targeting the 1.2658 level.
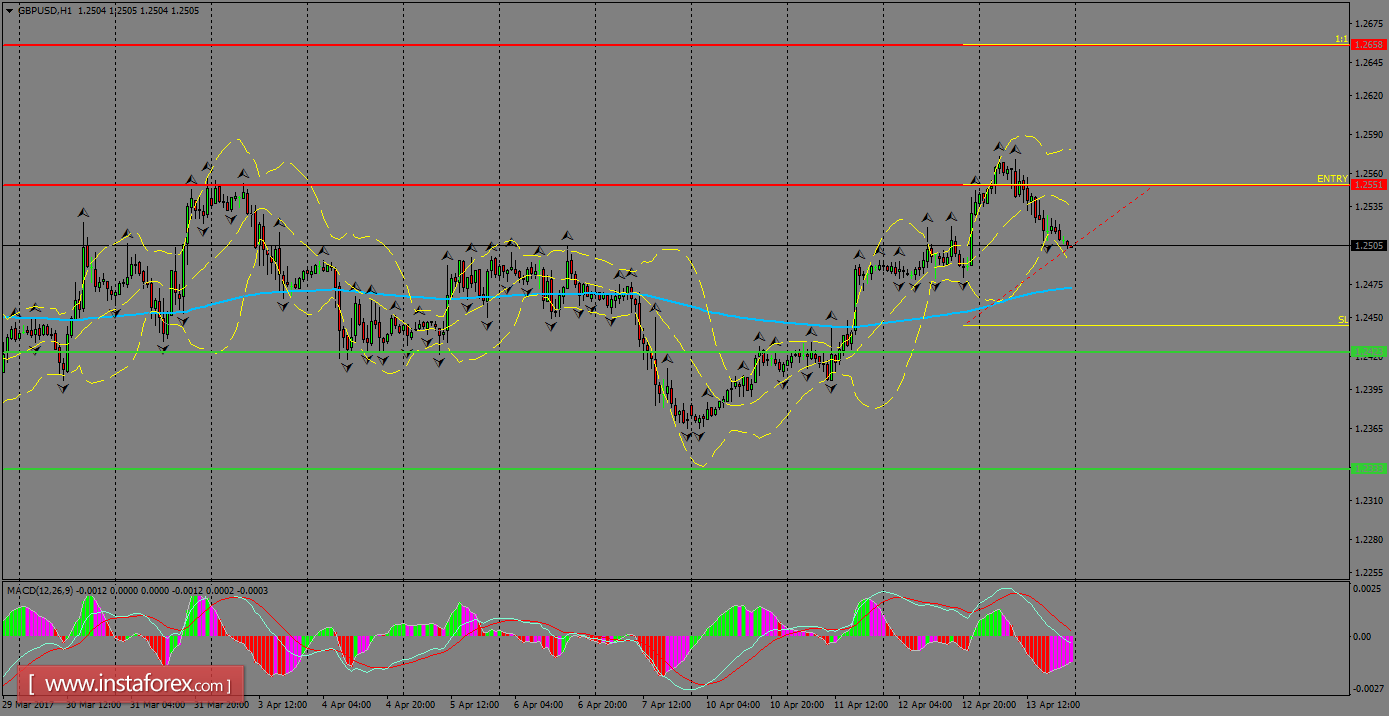
H1 chart's resistance levels: 1.2551 / 1.2658
H1 chart's support levels: 1.2423 / 1.2333
Trading recommendations for today: Based on the H1 chart, buy (long) orders only if the GBP/USD pair breaks a bullish candlestick; the resistance level is at 1.2551, take profit is at 1.2658 and stop loss is at 1.2443.


