


GBP/USD is trying to keep its bullish tone above the 200 SMA amid USD weakness across the board, following last week's Trump commentaries on the greenback. The price action still points to the upside and that's why we're following the 1.2551 and 1.2658 levels as the next targets in this path. However, some pullbacks could take place towards 1.2423, which is below the 200 SMA at H1 chart.
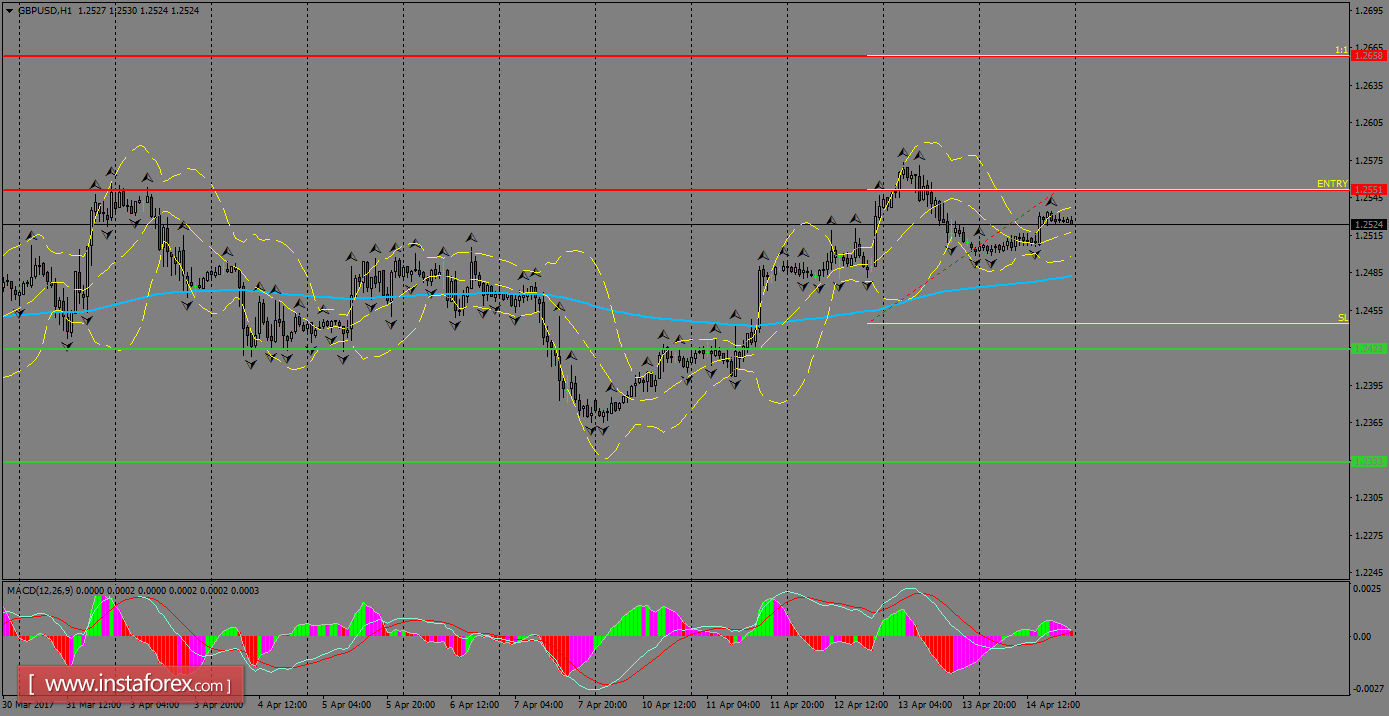
H1 chart's resistance levels: 1.2551 / 1.2658
H1 chart's support levels: 1.2423 / 1.2333
Trading recommendations for today: Based on the H1 chart, buy (long) orders only if the GBP/USD pair breaks a bullish candlestick; the resistance level is at 1.2551, take profit is at 1.2658 and stop loss is at 1.2443.


