


Overview:
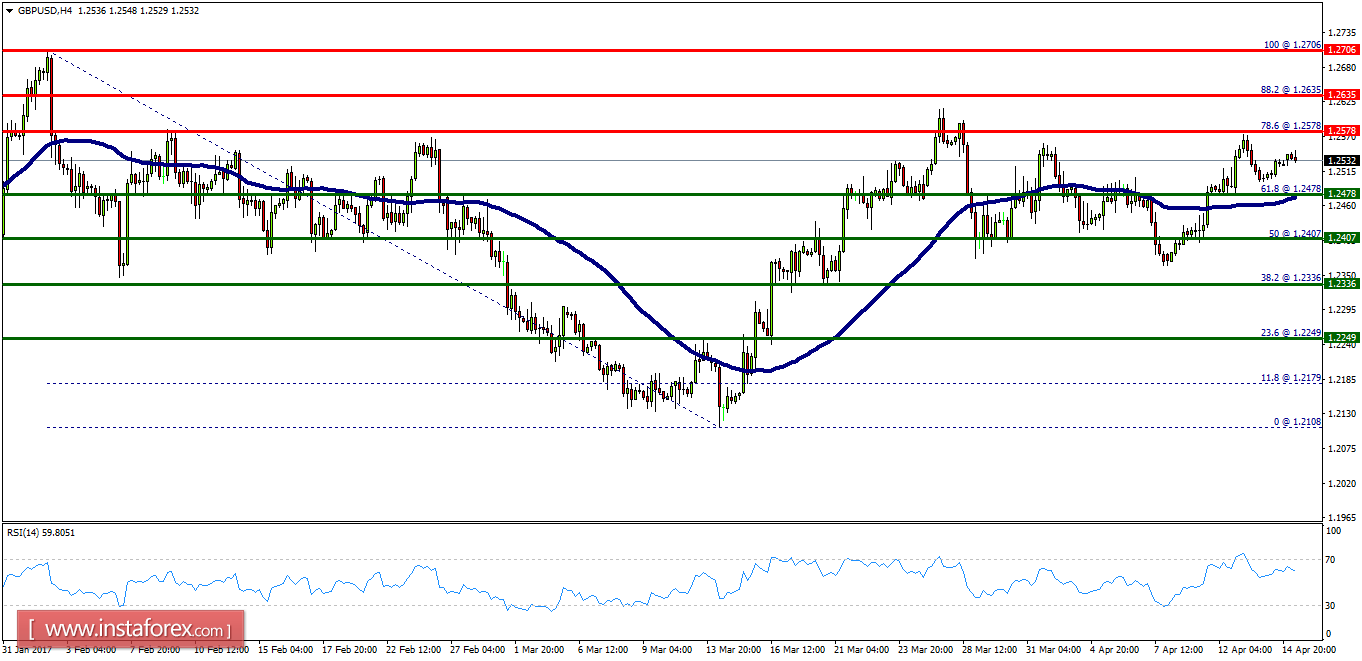
- The GBP/USD pair faced strong support at the levels of 1.2336 1.2407 and 1.2478. However, the minor resistance is seen at the level of 1.2478, and the pair is likely to try to approach it in order to test it again. If the pair fails to pass through the level of 1.2478, the market will indicate a bullish opportunity above the new support level of 1.2478 which coincides with the ratio of 61.8% Fibonacci. Moreover, the RSI starts signaling an upward trend, but the trend is still showing strength above the moving average 100. The market is indicating a bullish opportunity above 1.2478, so it will be good to buy at 1.2478 with the first target of 1.2578. It will also call for an uptrend in order to continue towards 1.2635 (resistance 2). The weekly strong resistance is seen at the level of 1.2635. The stop loss should always be taken into account. It will be reasonable to set your stop loss at the level of 1.2336.


