


The US dollar index reversed and got rejected at 101.30 when we expected it last week. Now it is in a short-term bearish trend. The price is in the important support area where we could see another upward turnaround.
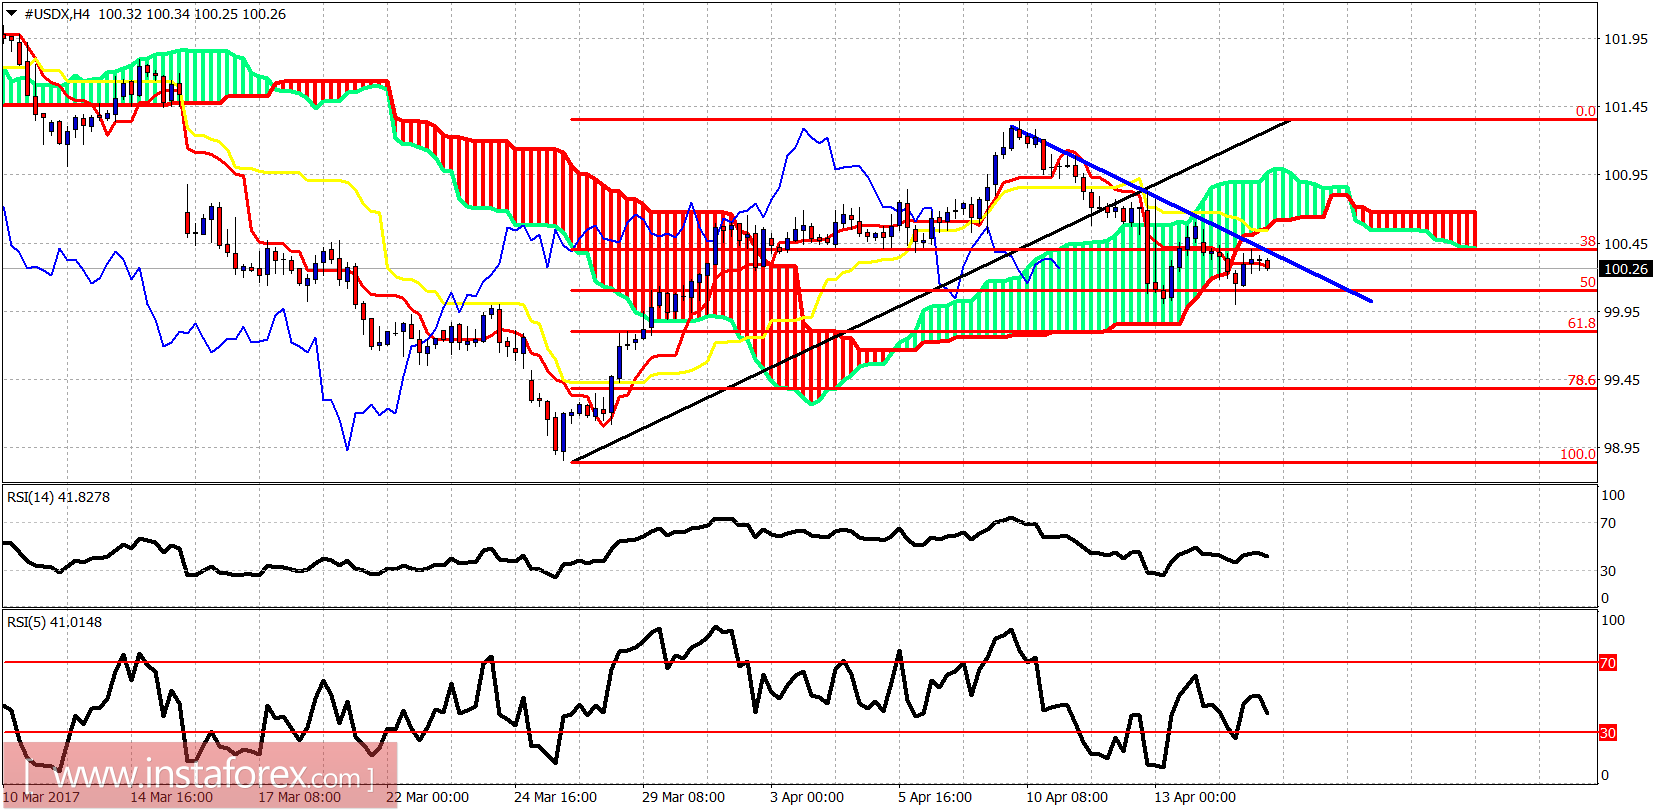
Blue line - short-term resistance trend line
The dollar index is trading below the 4 hour Kumo (cloud) and the blue trend line resistance. Resistance is found at 100.60. Support lies at 99.80 where we also find the 61.8% Fibonacci retracement of the latest upward move from the important lows at 98.80.
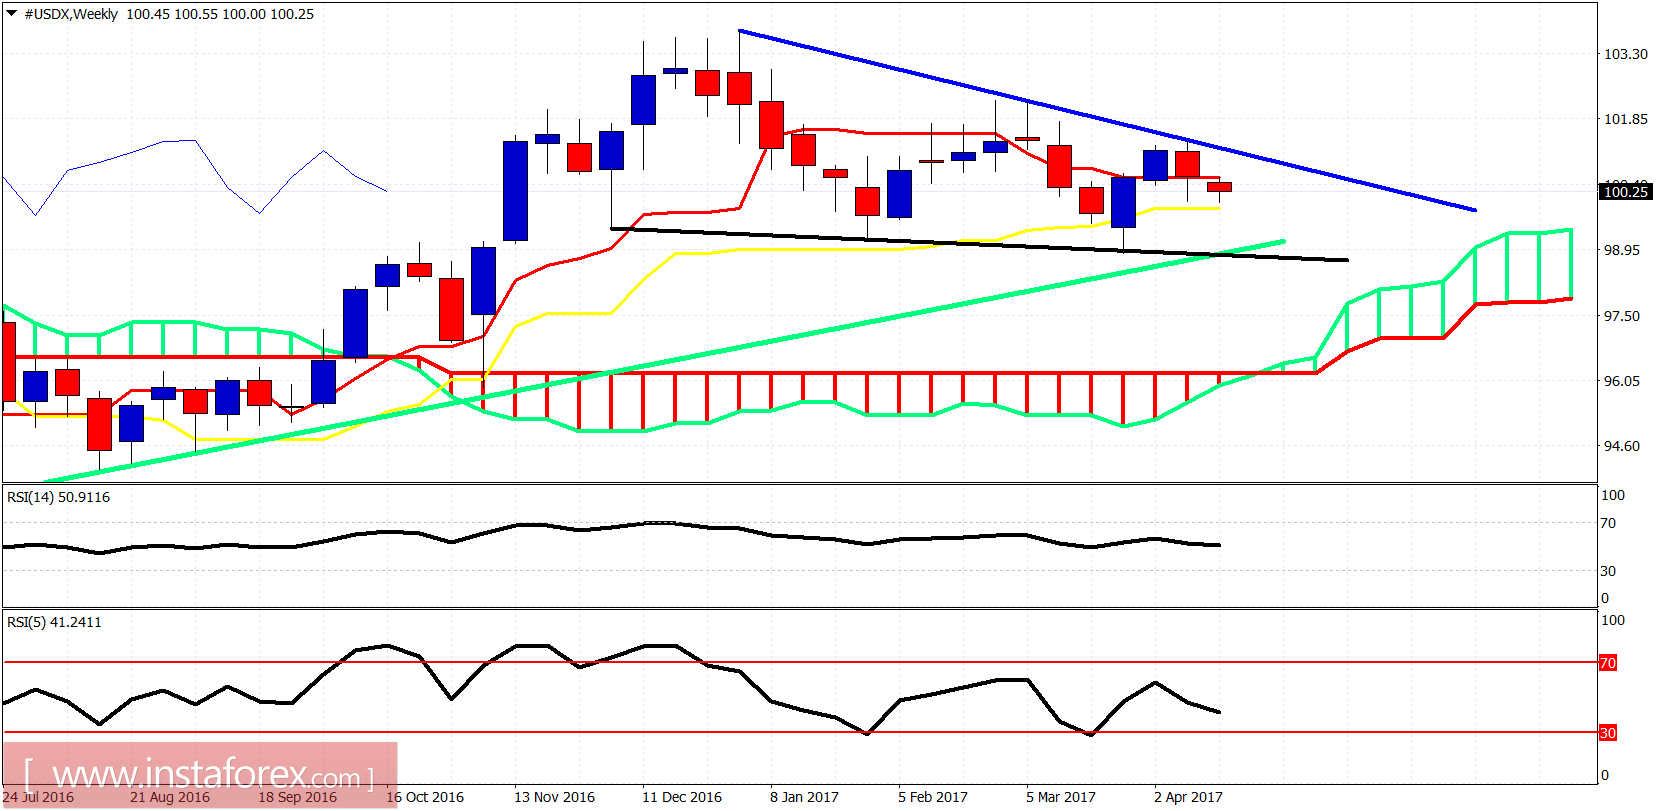
Black line - medium-term support trend line
Green line - long-term support trend line
Weekly resistance remains in the area of 101.30-101.50 by the downward sloping trend line. Weekly support is at 99-98.80 where the medium-term and long-term support trend lines meet. Long-term trend remains bullish as price the holds above the Kumo (cloud). However, there will be intense warnings if the price closes below the weekly kijun-sen at 99.80.


