Main Quotes Calendar Forum
flag

FX.co ★ Ichimoku indicator analysis of gold for April 19, 2017

parent
Forex Analysis:::2017-04-19T07:11:36

Ichimoku indicator analysis of gold for April 19, 2017

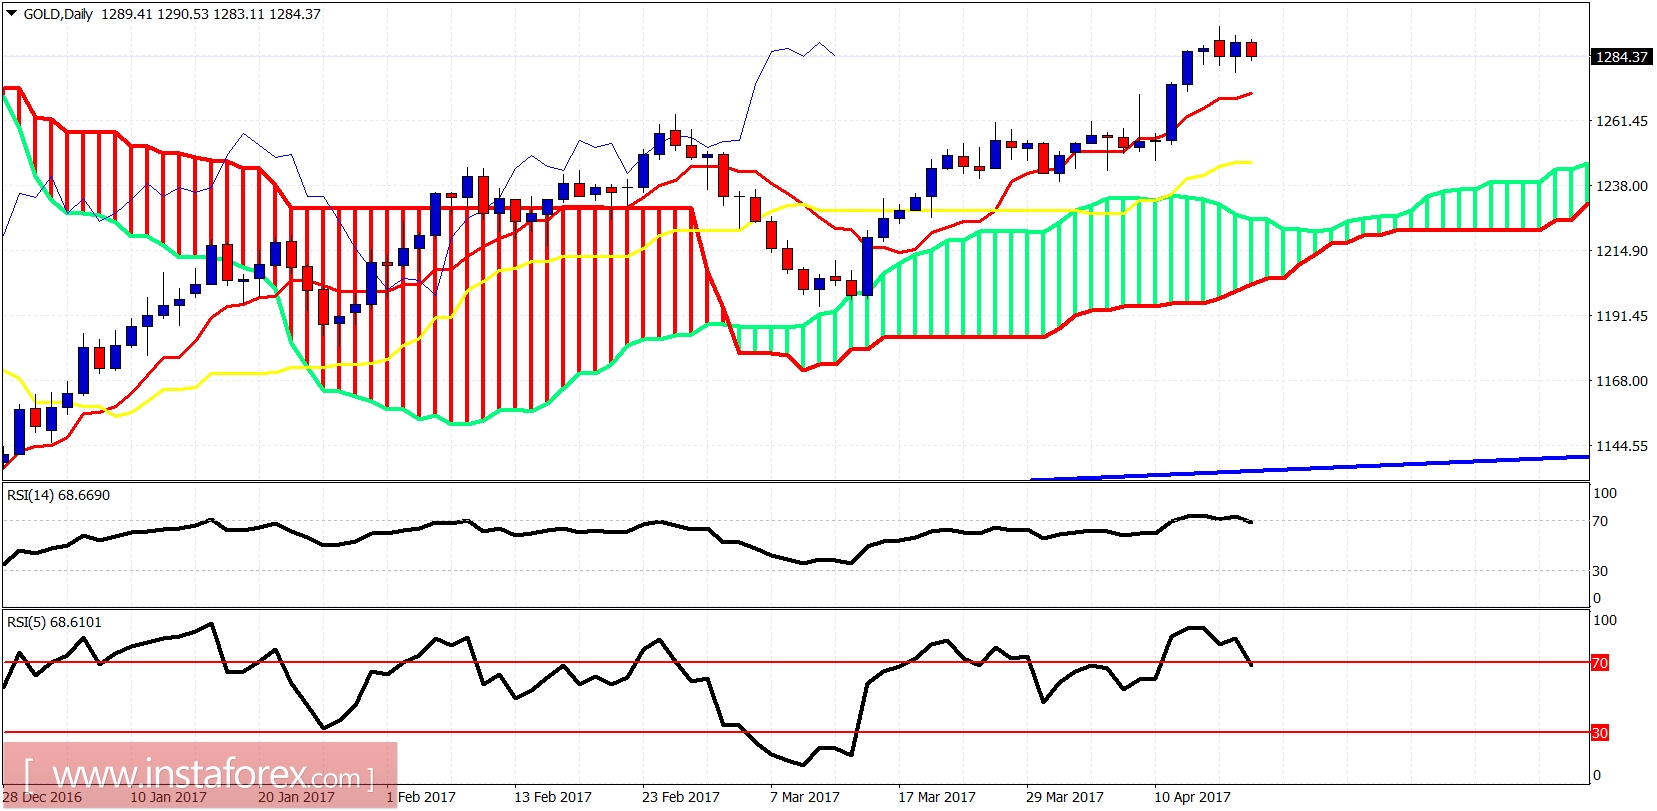
Gold price has stopped rising from $1,230 at $1,290-95 area where the long-term resistance is found. A pullback is justified towards $1,270 at least but this will happen only if we break below $1,280.

Ichimoku indicator analysis of gold for April 19, 2017

Blue line - trend line support

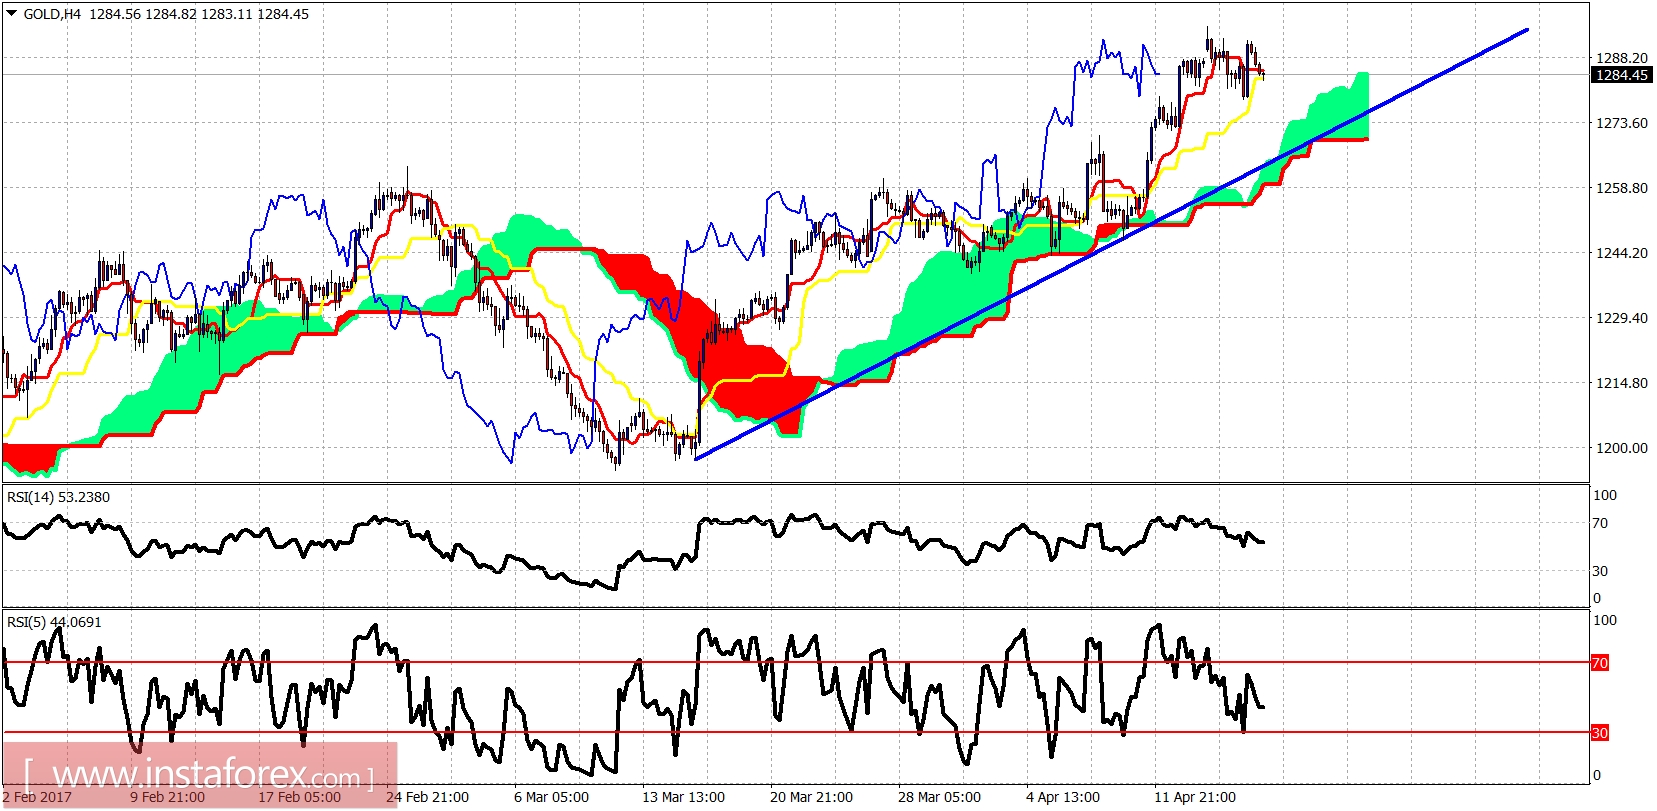
Gold price is trading above the Kumo cloud and is making higher highs and higher lows. Price is testing kijun-sen (yellow line indicator) support at $1,283. A daily close below $1,280 will open the way for a push towards $1,260-70. Resistance is at $1,293.

Ichimoku indicator analysis of gold for April 19, 2017

A bullish trend can be clearly seen on a daily time frame, but the overbought signs make me worry of a possible pullback towards even the $1,220 level. This is where daily support by the cloud is found. Kijun-sen daily support indicator is at $1,245 which is also an important support level. Overall, I remain longer-term bullish but would only buy or add after a pullback.
Analyst InstaForex
Share this article:
parent
loader...
all-was_read__icon
You have watched all the best publications
presently.
We are already looking for something interesting for you...
all-was_read__star
Recently published:
loader...
More recent publications...