


The index is recovering from its recent decline below the 100.00 psychological level and it seems that it could re-test the resistance zone of 99.97. If USDX manages to break above that area, we can expect further strength to reach the 100.54 level, which is above the 200 SMA at H1 chart. However, our preferred scenario is still the bearish side.
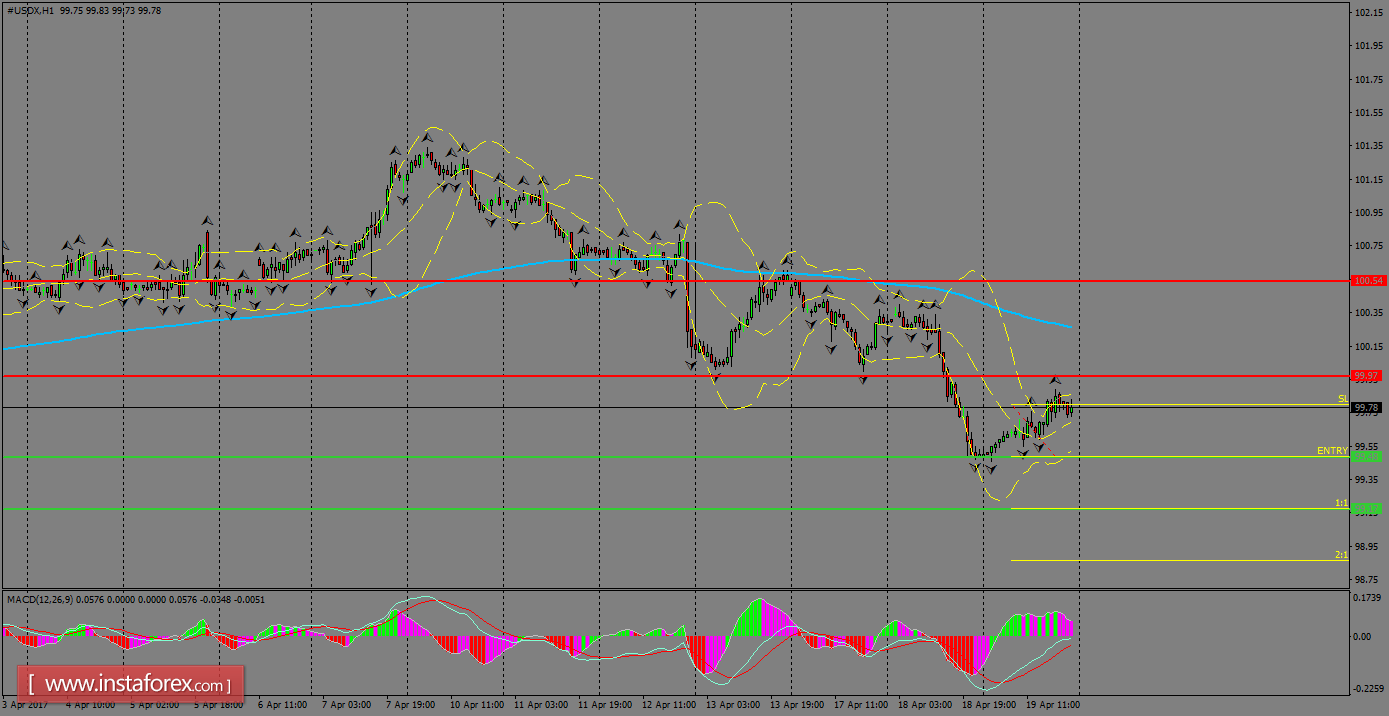
H1 chart's resistance levels: 99.97 / 100.54
H1 chart's support levels: 99.48 / 99.17
Trading recommendations for today: Based on the H1 chart, place sell (short) orders only if the USD Index breaks with a bearish candlestick; the support level is at 99.48, take profit is at 99.17 and stop loss is at 99.79.


