


Overview:
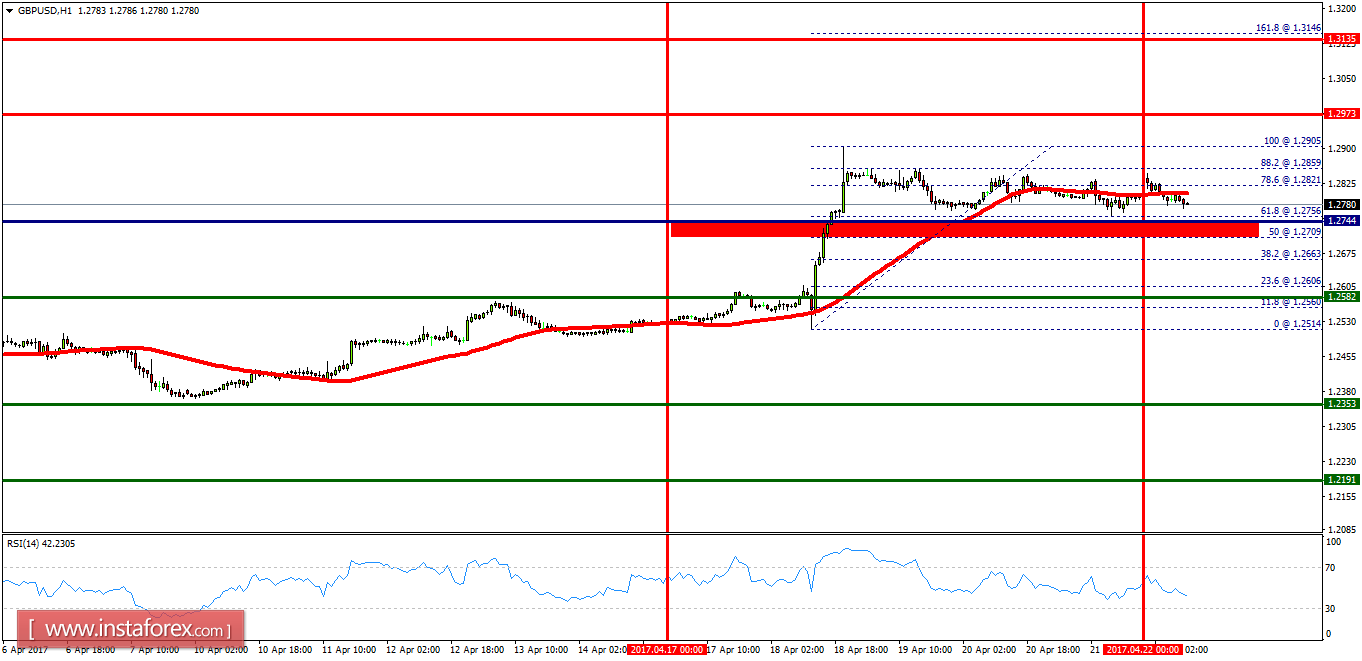
- The market opened below the double bottom (1.2905). It continued to move downwards from the level of 1.2847 to the bottom around 1.2773. Today, the first resistance level is seen at 1.2973 followed by 1.3135, while daily support 1 is seen at 1.2744. Right now, the pair is trading below the level of 1.2905. It is likely to trade in a lower range as long as it remains below the support (1.2973) which is expected to act as major support today. This would suggest a bearish market because the moving average (100) is still in a negative area and does not show any signs of a trend reversal at the moment. Amid the previous events, the GBP/USD pair is still moving between the levels of 1.2847 and 1.2582. Therefore, the major resistance can be found at 1.2973 providing a clear signal to sell with a target seen at 1.2744. If the trend breaks the minor support at 1.2744, the pair will move downwards continuing the bearish trend development to the level of 1.2582 in order to test the weekly support 1. Overall, we still prefer the bearish scenario which suggests that the pair will stay below the zone of 1.2973 this week.
Weekly technical analysis:
- Resistance 3:1.3364
- Resistance 2:1.3135
- Resistance 1:1.2973
- Pivot Point:1.2744
- Support 1:1.2582
- Support 2:1.2353
- Support 31.2191


