Main Quotes Calendar Forum
flag

FX.co ★ Ichimoku indicator analysis of gold for April 27, 2017

parent
Forex Analysis:::2017-04-27T07:21:19

Ichimoku indicator analysis of gold for April 27, 2017

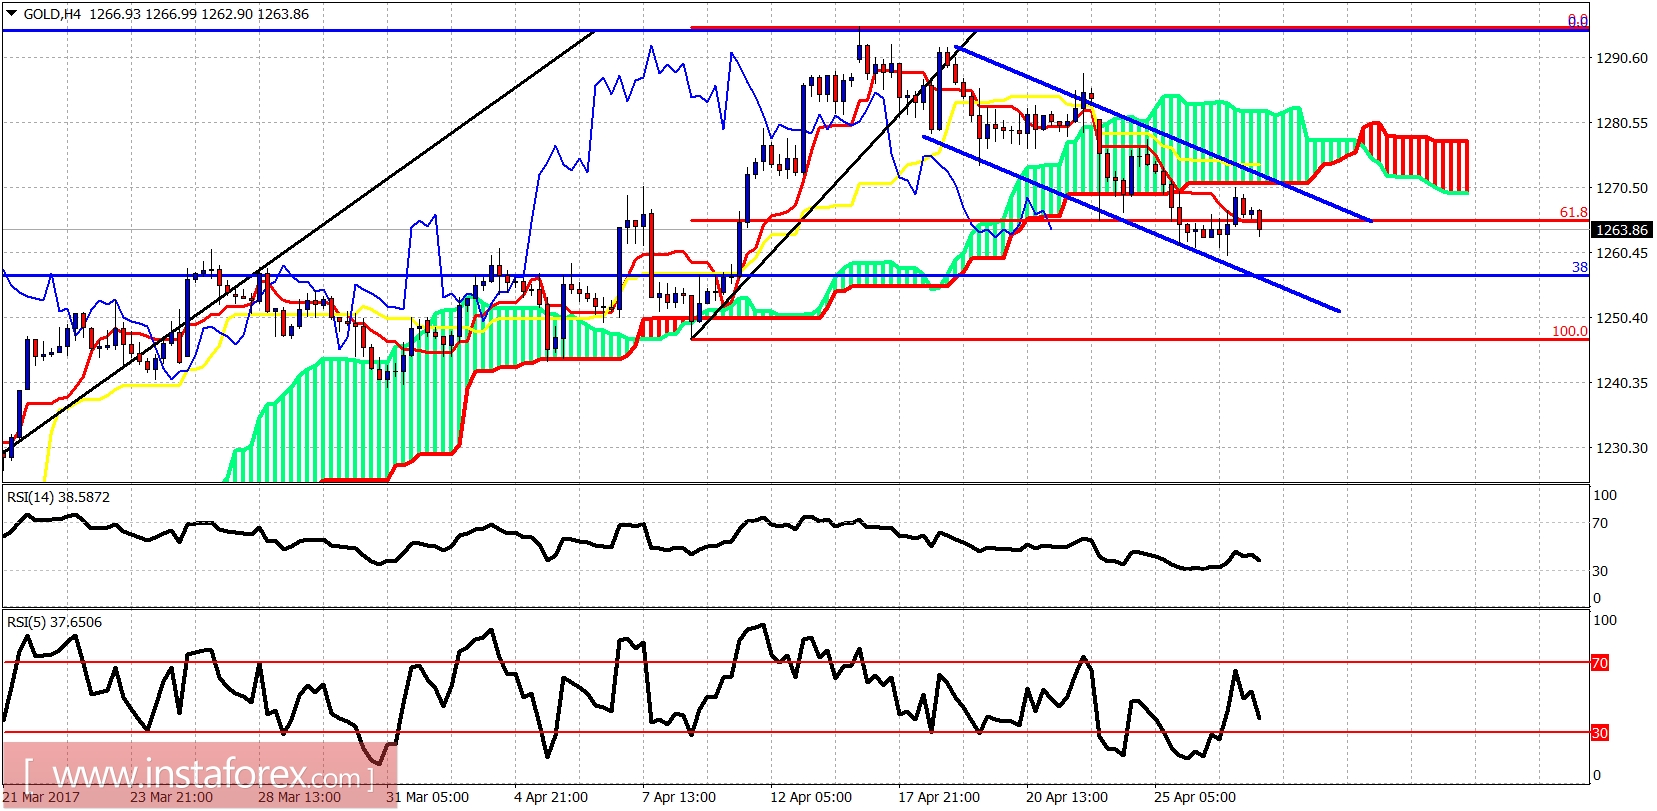
Gold, as expected, bounced towards short-term cloud resistance but got rejected. Recent lows are important short-term support. A break above yesterday highs could signal that an important short-term low is in.

Ichimoku indicator analysis of gold for April 27, 2017

Gold price is trading below the Kumo (cloud) of the 4-hour chart. Price is still inside the bearish channel and yesterday it reached the lower cloud boundary resistance and got rejected. Resistance is at $1,271. Support is at $1,260. Breaking support will push it to $1,250-45. Breaking resistance will push it to $1,285.

Ichimoku indicator analysis of gold for April 27, 2017

Daily Gold price candles are trading right above the kijun-sen support indicator. Price could reverse to the upside from current levels and bulls should use $1,260 as a stop for short-term trades. My long-term bullish view remains unchanged.
Analyst InstaForex
Share this article:
parent
loader...
all-was_read__icon
You have watched all the best publications
presently.
We are already looking for something interesting for you...
all-was_read__star
Recently published:
loader...
More recent publications...