


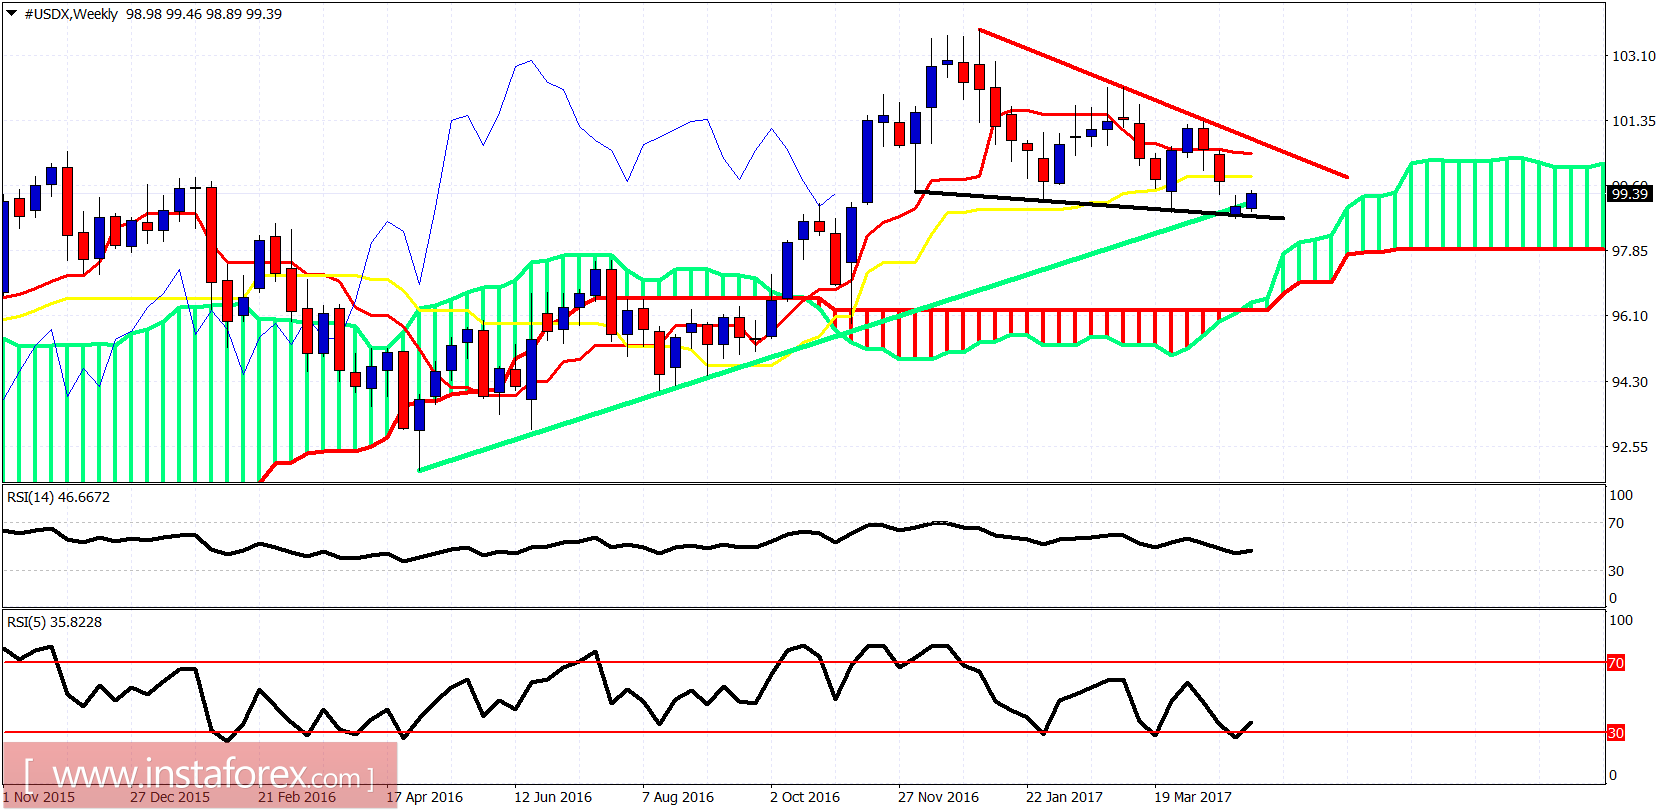
The Dollar index is bouncing as we expected and is showing signs of exiting the short-term trading range to the upside. Price remains in a weekly down trend since 103.30 but on a break above 101.30 the bullish scenario will strengthen dramatically.
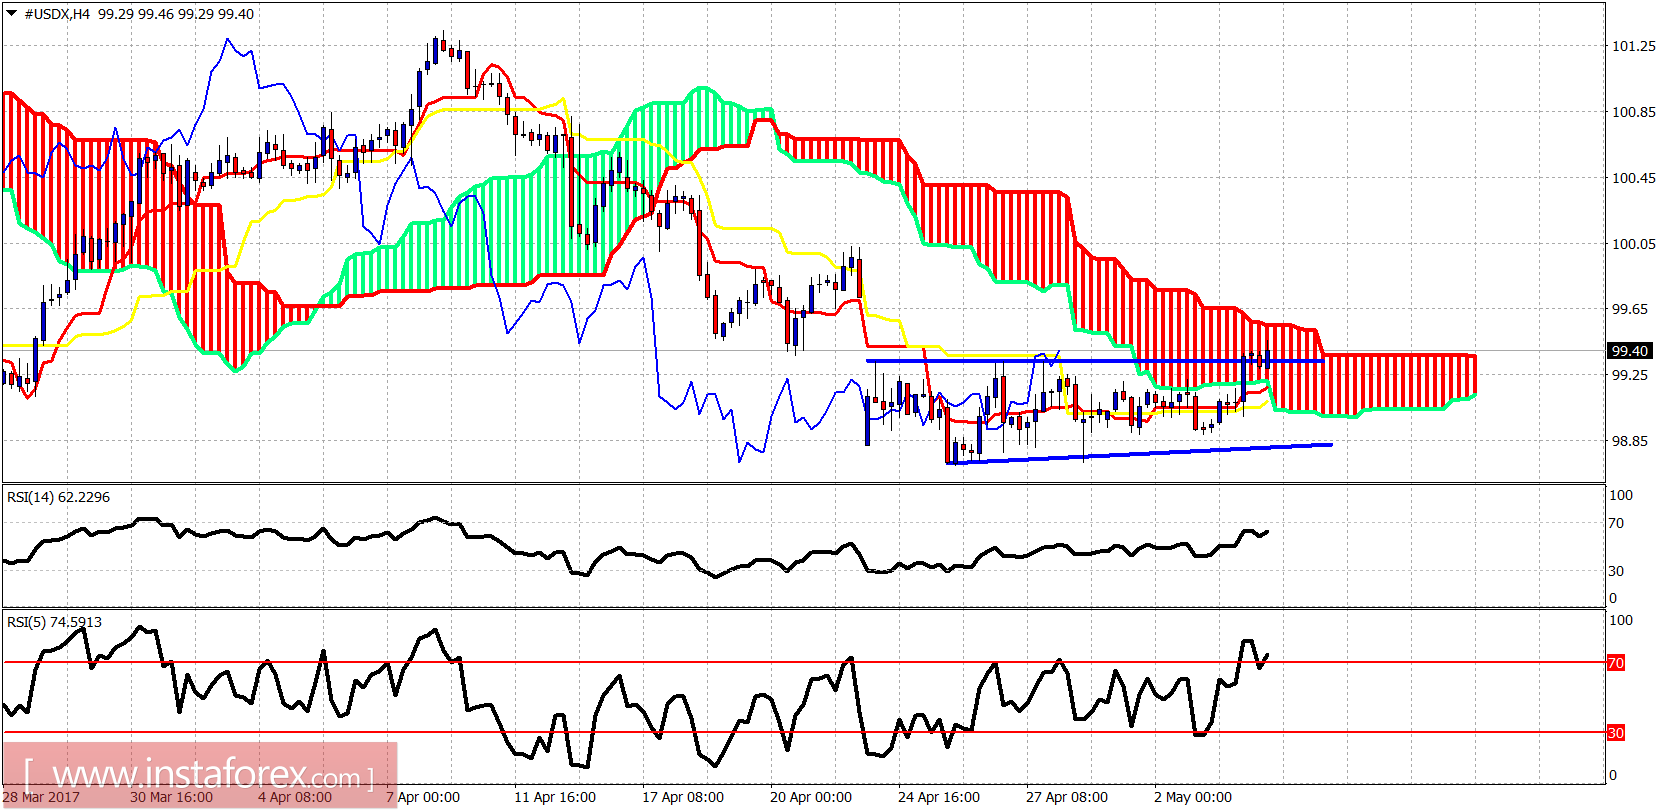
The Dollar index is trying to break above the Kumo on the 4-hour chart. This could ignite more Dollar strength towards 101. Important short-term support is at 99.05 where the 4-hour kijun-sen is found. Breaking below it will open the way for a push towards 98.
Black line - support
Green line - long-term trend line support
The Dollar index is showing reversal signs in the weekly chart as expected. The Dollar index should bounce strongly towards 99.83 where the first weekly important resistance level is found. Breaking above it will open the way for a push towards 100.50.


