


Gold price continues to make lower lows and lower highs. Trend remains bearish. Gold has limited downside. I still prefer bullish positions at the current levels.
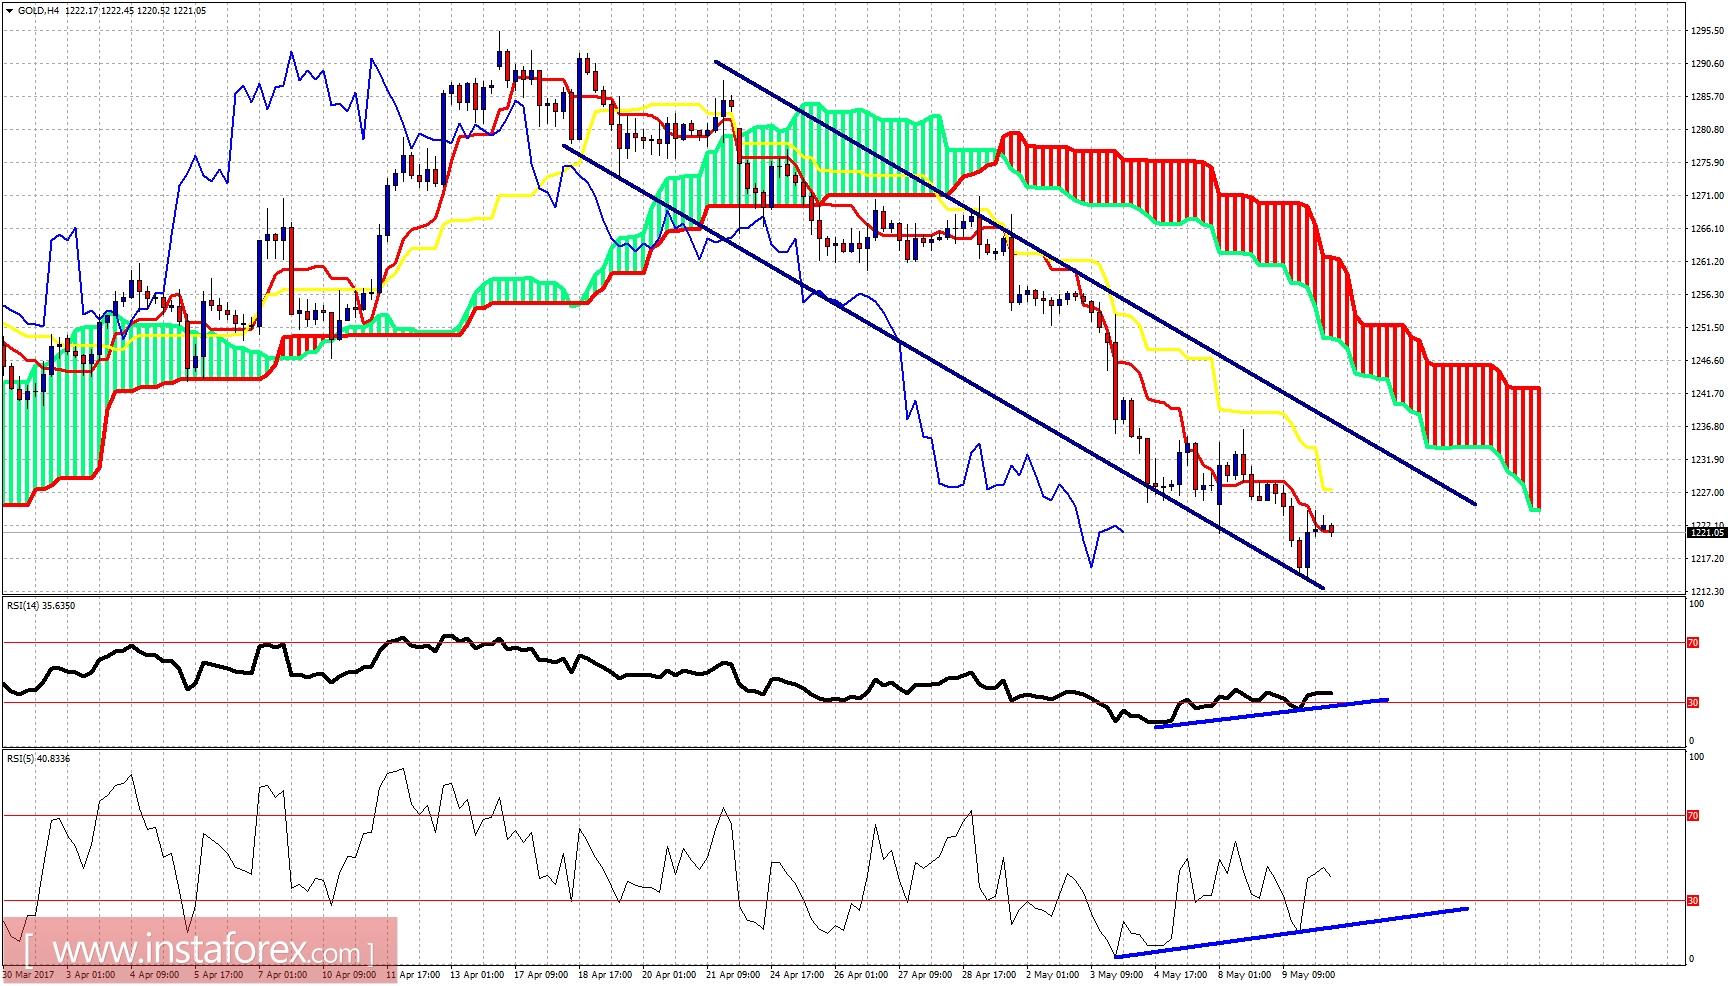
Despite being still inside the bearish channel and below both the tenkan- and kijun-sen, the RSI divergence signals that gold is just above previous lows at $1,194. I believe there are a lot of chances for a move higher at least towards the Kumo resistance at $1,250.
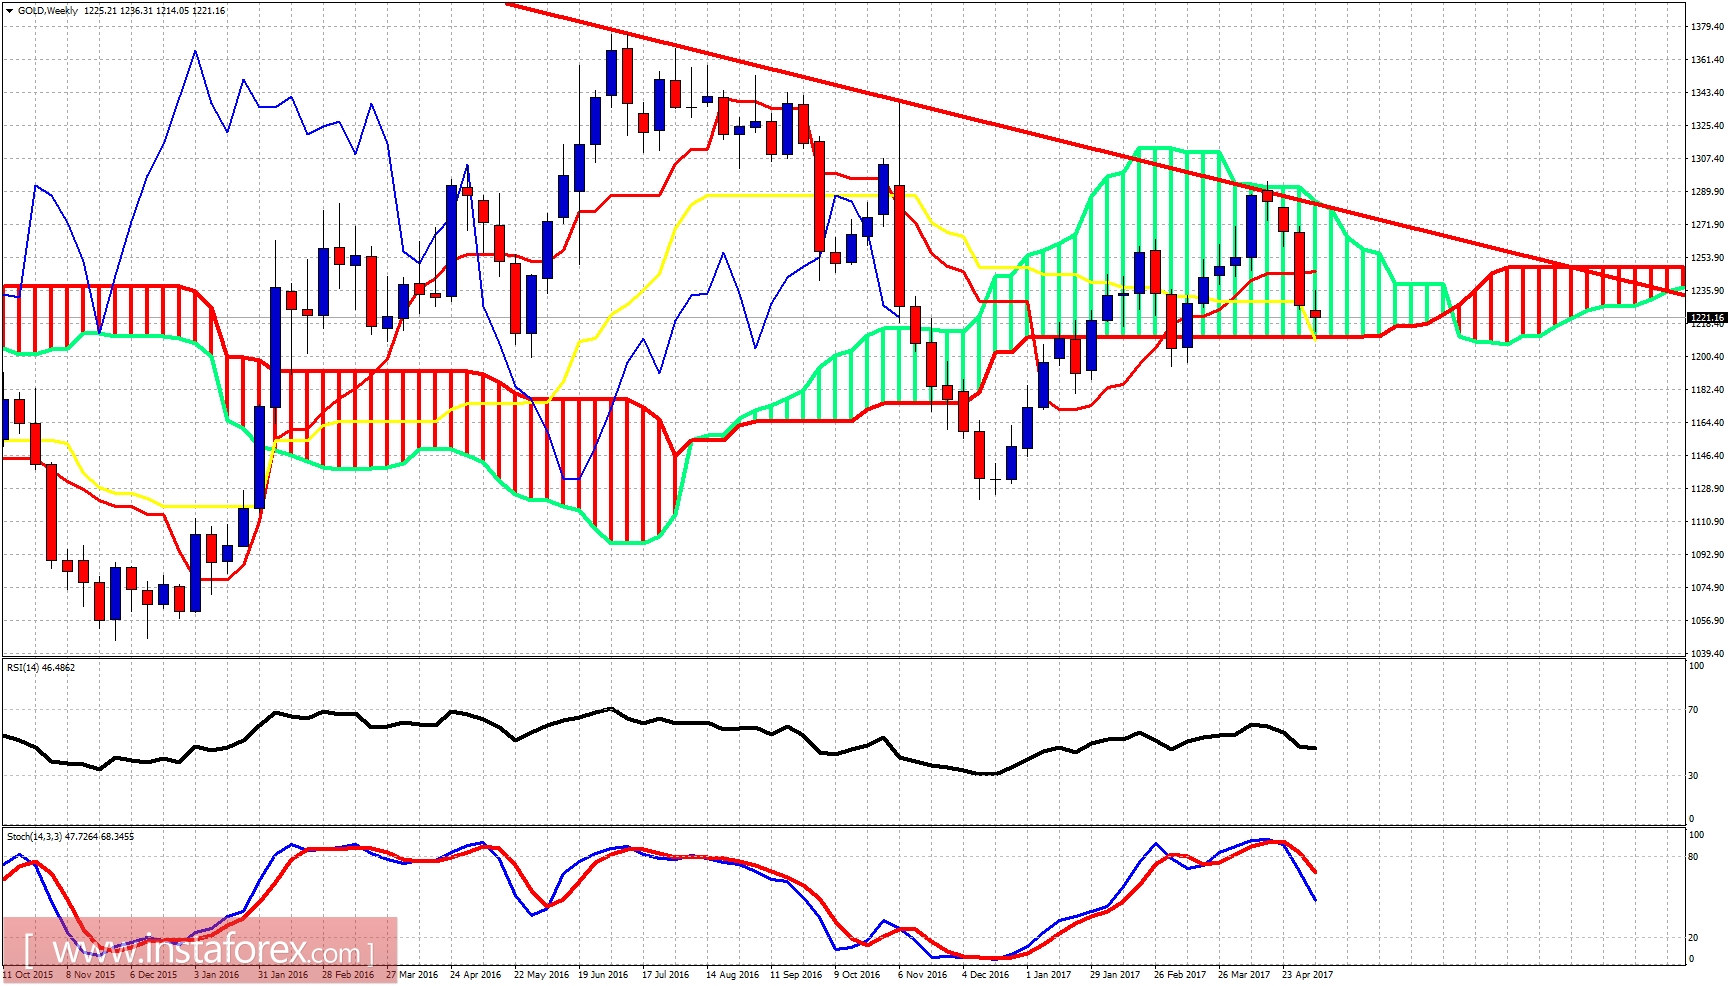
Gold price remains inside the weekly cloud but above the weekly kijun-sen. Price has held above the lower Kumo boundary and this is a positive sign. If Gold manages to make a higher low relative to the $1,194 low in March, we could expect a strong upward reversal start from around current levels.


