Main Quotes Calendar Forum
flag

FX.co ★ Ichimoku indicator analysis of gold for May 12, 2017

parent
Forex Analysis:::2017-05-12T07:44:43

Ichimoku indicator analysis of gold for May 12, 2017

Gold price is bouncing and trying to break out of the bearish channel. Trend remains bearish as price is below the 4-hour Kumo. Important resistance levels ahead at $1,245 and at $1,260 must be broken so that the bullish scenario of $1,300-$1,400 is realized.

Ichimoku indicator analysis of gold for May 12, 2017

Blue lines - bearish channel

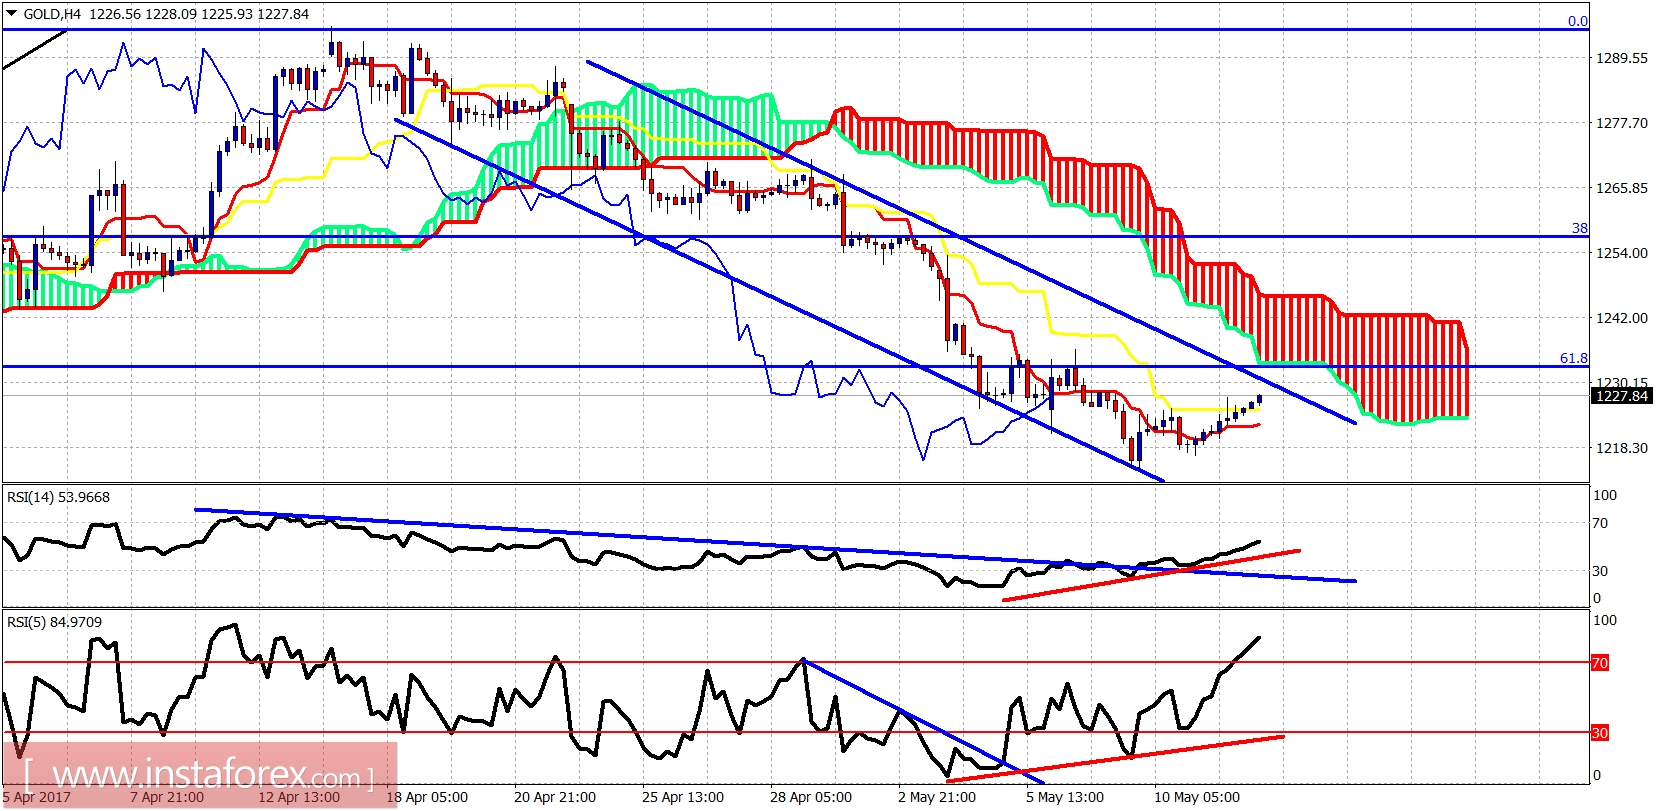
Gold price is breaking above the tenkan- and kijun-sen indicators on the 4-hour chart. Price remains below the Kumo and is still inside the bearish channel. Trend remains bearish. Short-term resistance is at $1,230 but the most important level is at $1,245 and at $1,260.

Ichimoku indicator analysis of gold for May 12, 2017

As expected by my last few posts, Gold is finally bouncing off the $1,200-$1,220 area. The

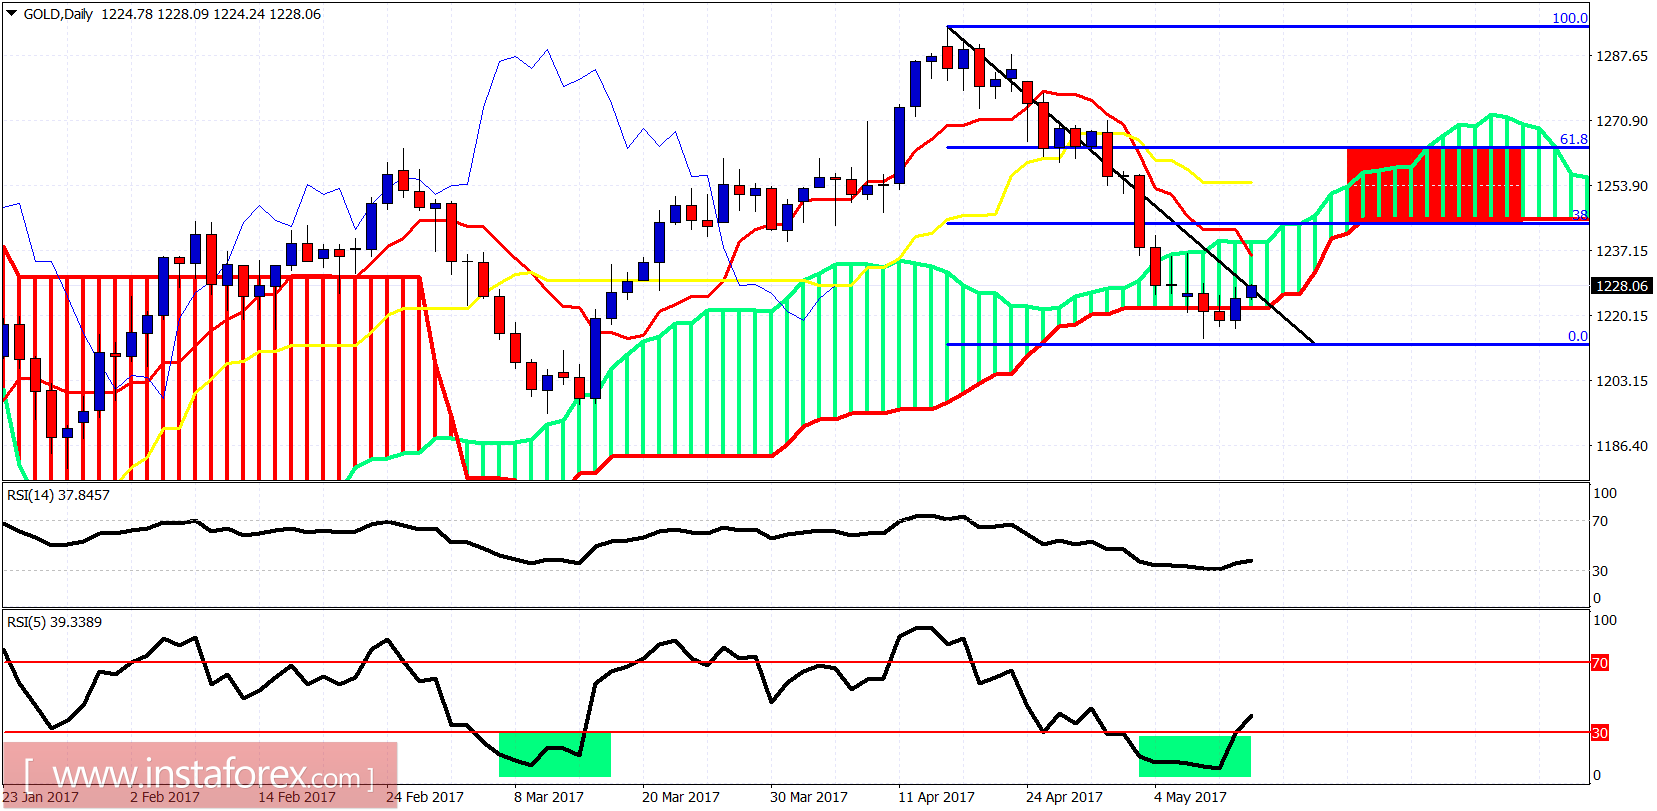
target is between $1,240 and $1,260. Breaking above it will open the way for a bullish move above $1,300.

Analyst InstaForex
Share this article:
parent
loader...
all-was_read__icon
You have watched all the best publications
presently.
We are already looking for something interesting for you...
all-was_read__star
Recently published:
loader...
More recent publications...