


GBP/USD is hovering in a sideways range across the board, with a support found around the 1.2855 level. Overall, the path is not clear and one could expect another rally to test the 1.2957 level. While our outlook remains bullish, we can expect further downside only if the Cable manages to break below the 1.2855 level, targeting the 1.2772 zone.
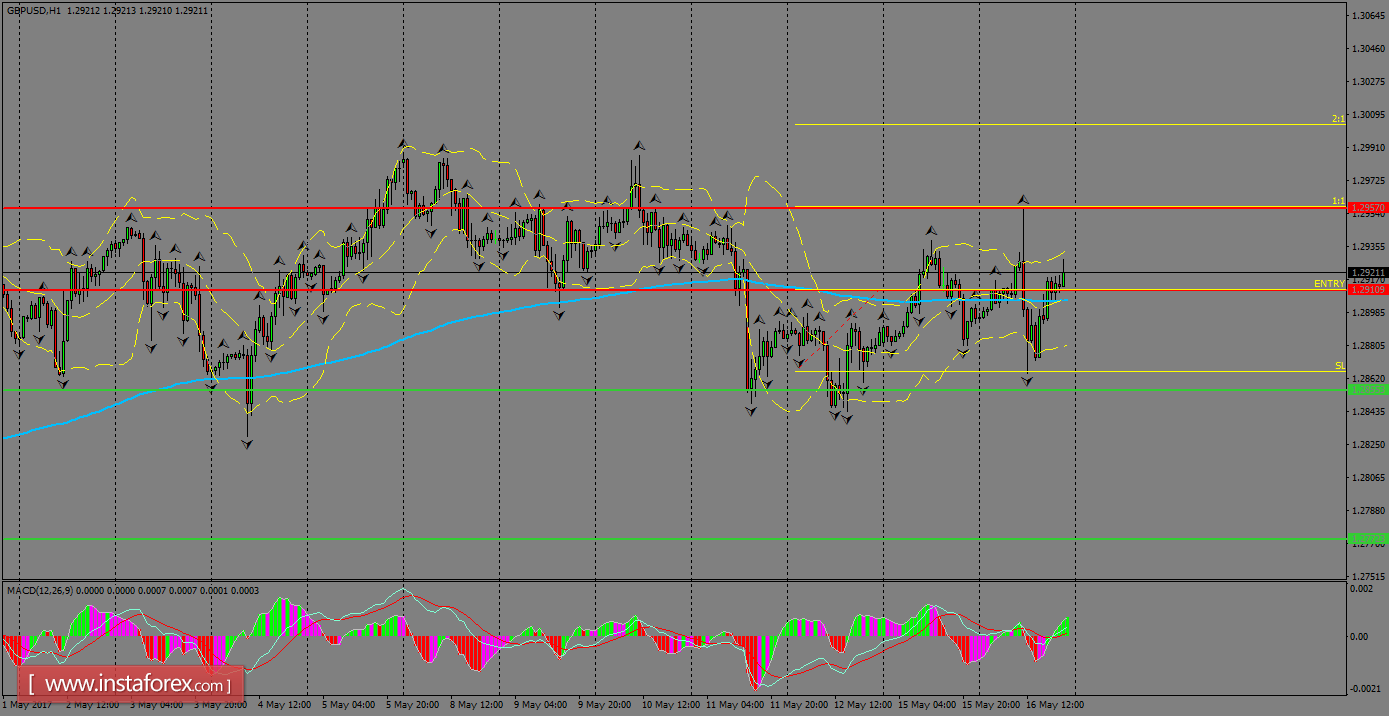
H1 chart's resistance levels: 1.2910 / 1.2957
H1 chart's support levels: 1.2855 / 1.2652
Trading recommendations for today: Based on the H1 chart, buy (long) orders only if the GBP/USD pair breaks a bullish candlestick; the resistance level is at 1.2910, take profit is at 1.2957 and stop loss is at 1.2887.


