Main Quotes Calendar Forum
flag

FX.co ★ Ichimoku indicator analysis of gold for May 18, 2017

parent
Forex Analysis:::2017-05-18T07:16:51

Ichimoku indicator analysis of gold for May 18, 2017

Gold price has reached our target of $1,250-60 as we mentioned in our recent posts since price was trading just above $1,215. Now it is time for a pullback as price has reached important resistance levels. A shallow retracement will be a bullish sign. A sharp decline could be the start for a final decline to $1,170.

Ichimoku indicator analysis of gold for May 18, 2017

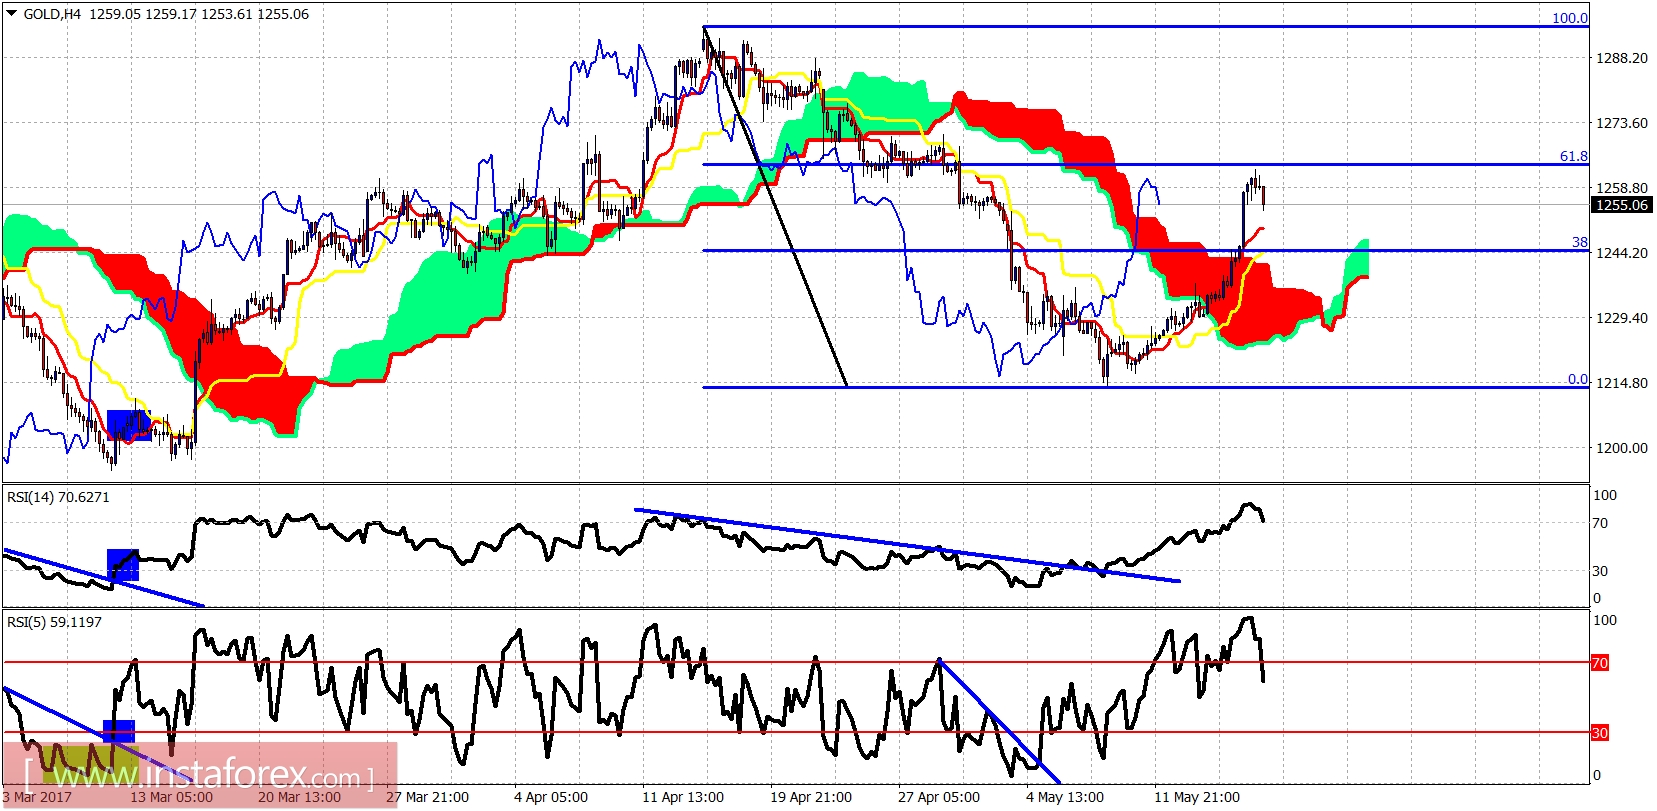
Gold price has reached the 61.8% Fibonacci retracement resistance. Price is above the cloud. Kumo support is at $1,240 and I expect this level to be tested. If Gold price breaks below the Kumo, then bears will regain control of the trend.

Ichimoku indicator analysis of gold for May 18, 2017

In the Daily chart Gold price has reached our target and it shows reversal signs. It is a very good sign that Gold has broken out and above the cloud but we also said in our previous posts that Gold should break above $1,260 for $1,300 to be achieved. Of course this cannot happen with one try. Gold should make a pullback to gather strength and then break upwards. Key support

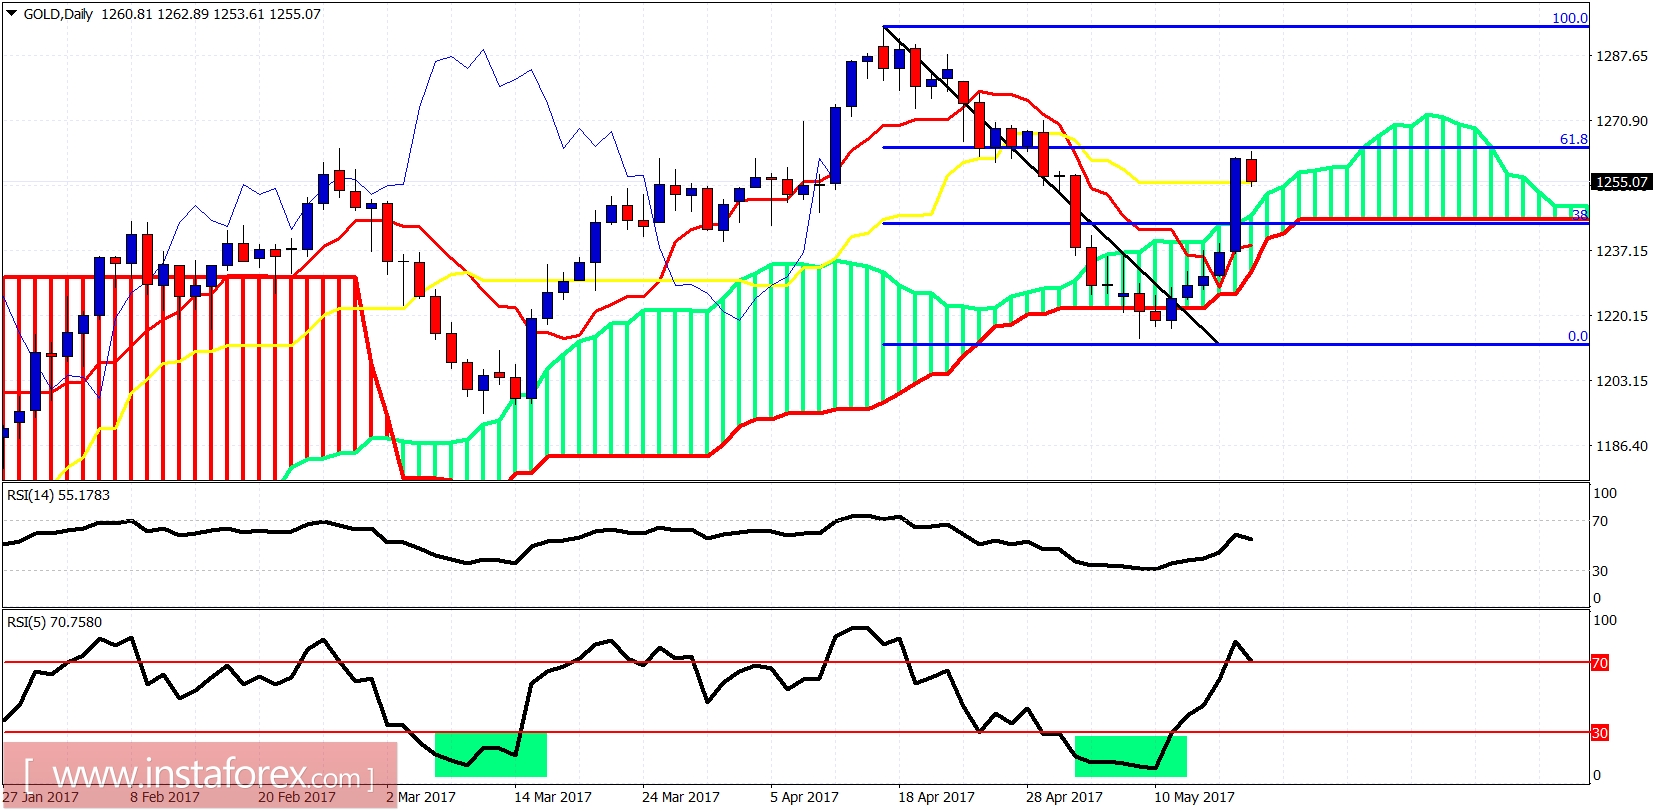
is seen at $1,217. If broken, we go to $1,150-70 before $1,300.

Analyst InstaForex
Share this article:
parent
loader...
all-was_read__icon
You have watched all the best publications
presently.
We are already looking for something interesting for you...
all-was_read__star
Recently published:
loader...
More recent publications...