


The Dollar index as expected is showing signs of reversal off the weekly Kumo. I continue to expect the Dollar index to strengthen significantly from current levels.

Red lines - bearish channel
Blue lines - trading range
The Dollar index has broken out of the bearish channel but remains below the 4-hour Kumo (cloud) and inside a sideways trading range. Cloud resistance is found at 97.50. Support is at 97.
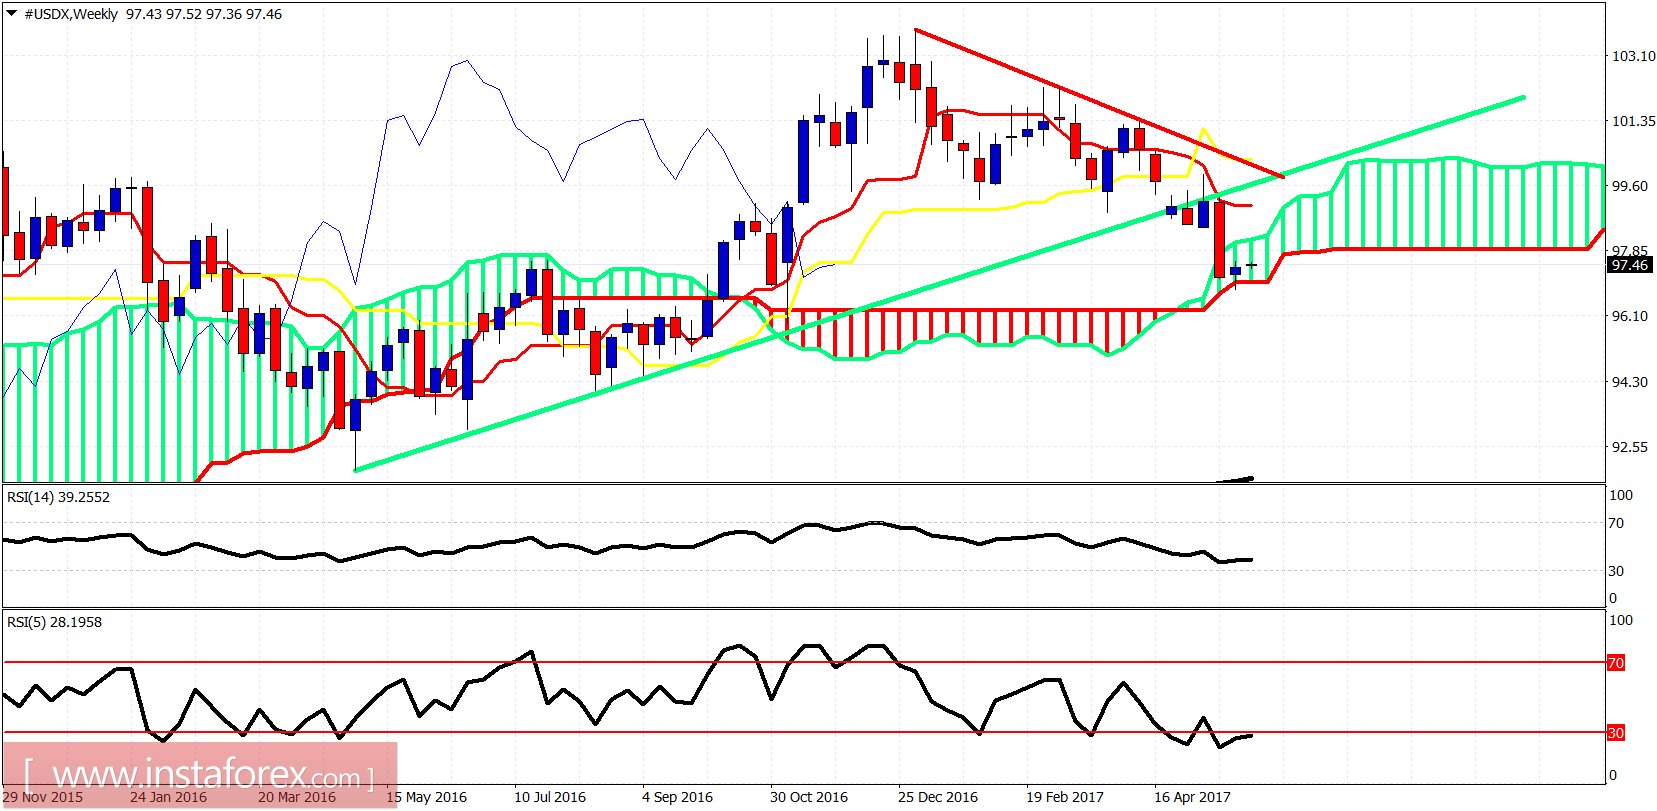
Red line - resistance
Green line - former long-term support trend line
The weekly candle is still above the weekly Kumo (cloud). The bounce is starting and it is a positive sign the fact that we did not break below cloud. I continue to expect a strong weekly bounce towards the upper cloud boundary or even the red downward sloping trend line. This is not the right time to be bearish about the US Dollar.


