


EUR/USD is making higher highs and higher lows but there are several warning signs in both the 4-hour and daily charts implying a pullback is imminent towards 1.1050 at least.
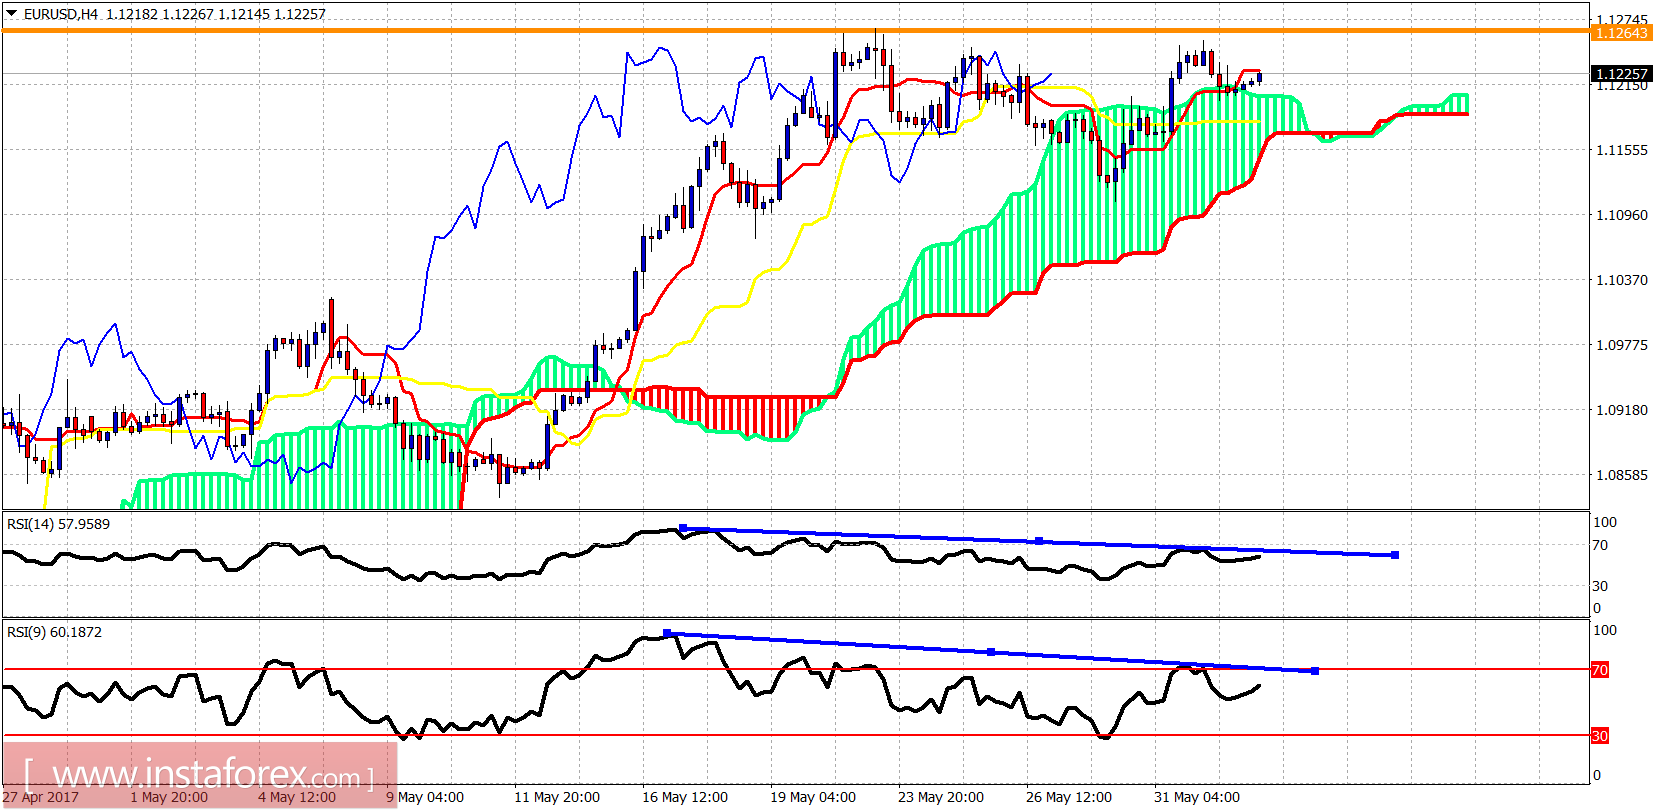
EUR/USD is trading above the 4-hour Kumo but has made a double top rejection so far at the 1.1260 area. The RSI provides negative divergence. We could see a new higher high but overall I expect EUR/USD to give a sell signal by breaking back inside the Kumo at 1.12 and moving lower.
Red line - long-term trend line support
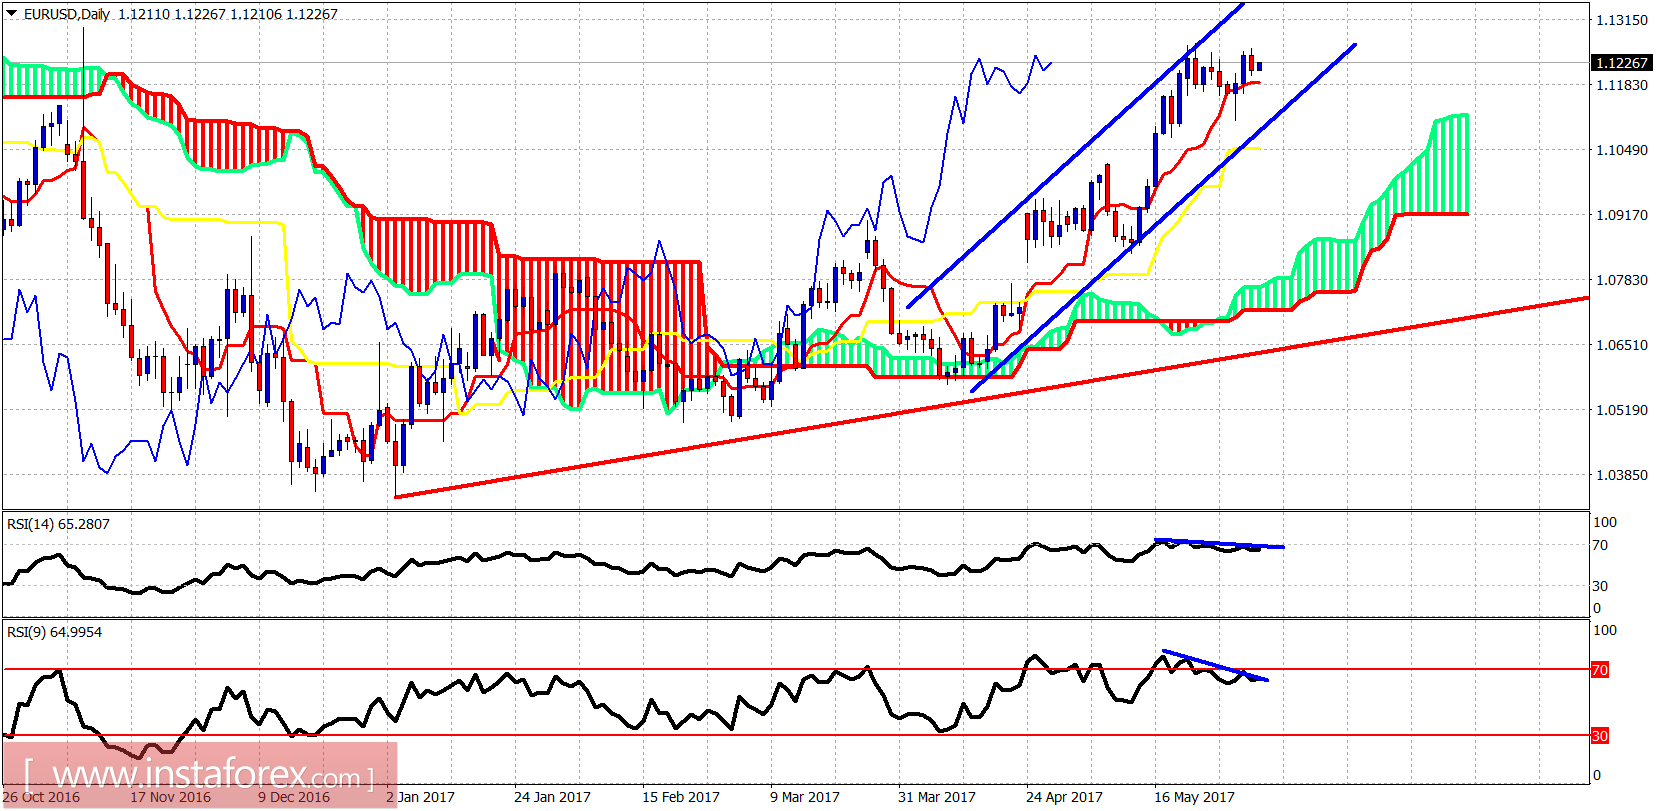
On a daily basis, EUR/USD is trading inside a bullish channel. Trend is bullish. However, short-term indicators point to a pullback towards at least the lower channel boundary above 1.1050 before the resumption of the uptrend. There are daily divergence signs supporting this view.


