Main Quotes Calendar Forum
flag

FX.co ★ Ichimoku indicator analysis of gold for June 6, 2017

parent
Forex Analysis:::2017-06-06T07:11:30

Ichimoku indicator analysis of gold for June 6, 2017

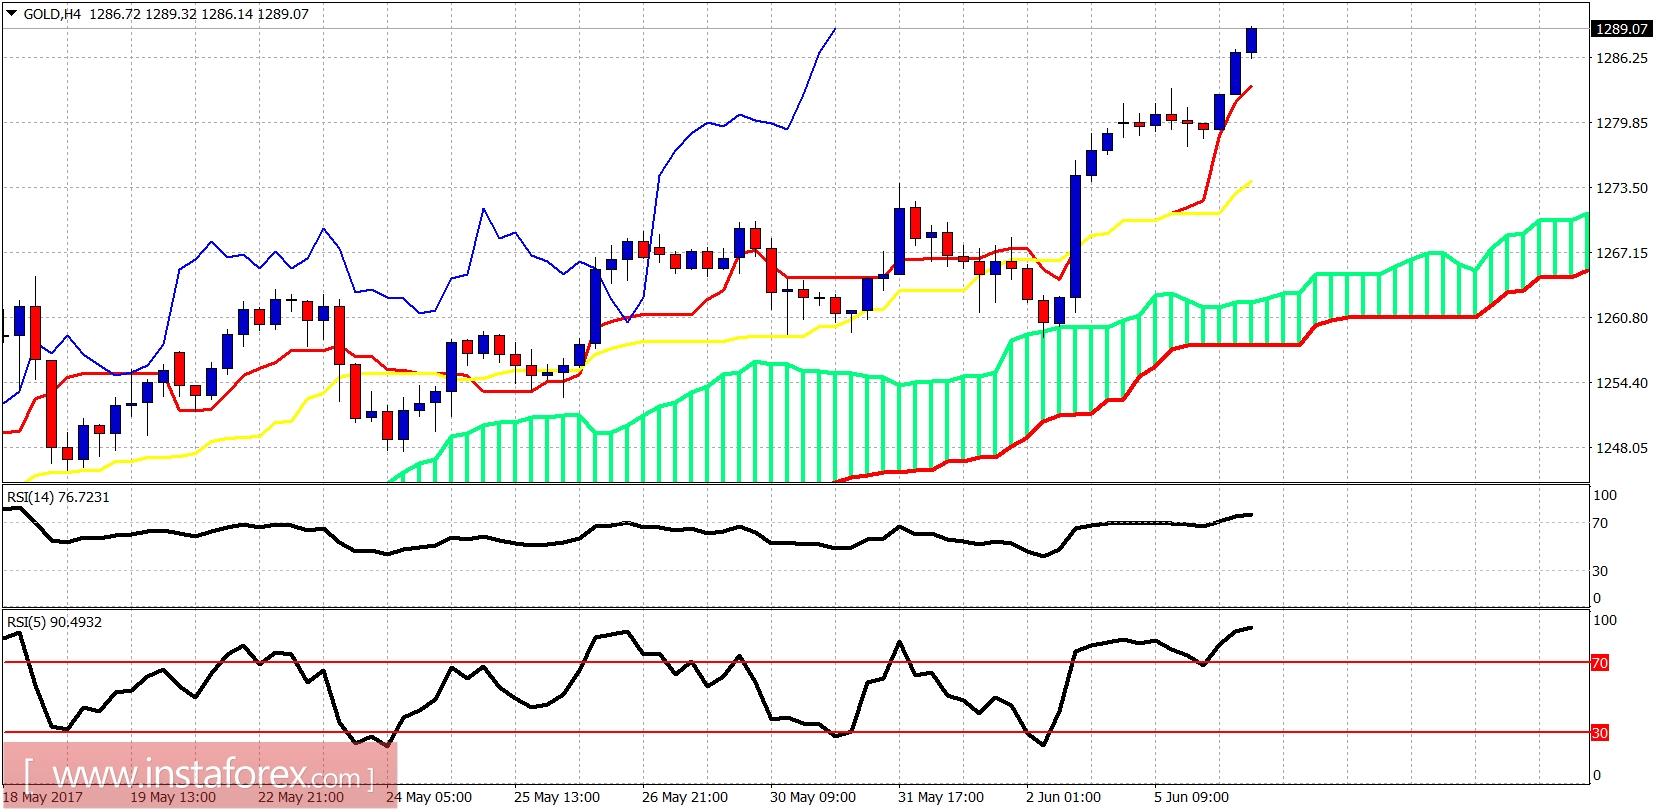
Gold price is reaching our targets we mentioned since early May. There are several indicators showing that this rally will be short-lived and bulls need to raise their stops and protect their positions. A pullback at least towards $1,250 is expected.

Ichimoku indicator analysis of gold for June 6, 2017

Gold price remains in a bullish trend as price continues to trade above both the tenkan- and kijun-sen indicators. Support is at $1,273. If broken the correction starts, next support will be at $1,260. Resistance is at $1,290-$1,300.

Ichimoku indicator analysis of gold for June 6, 2017

Black line - long-term trend line resistance

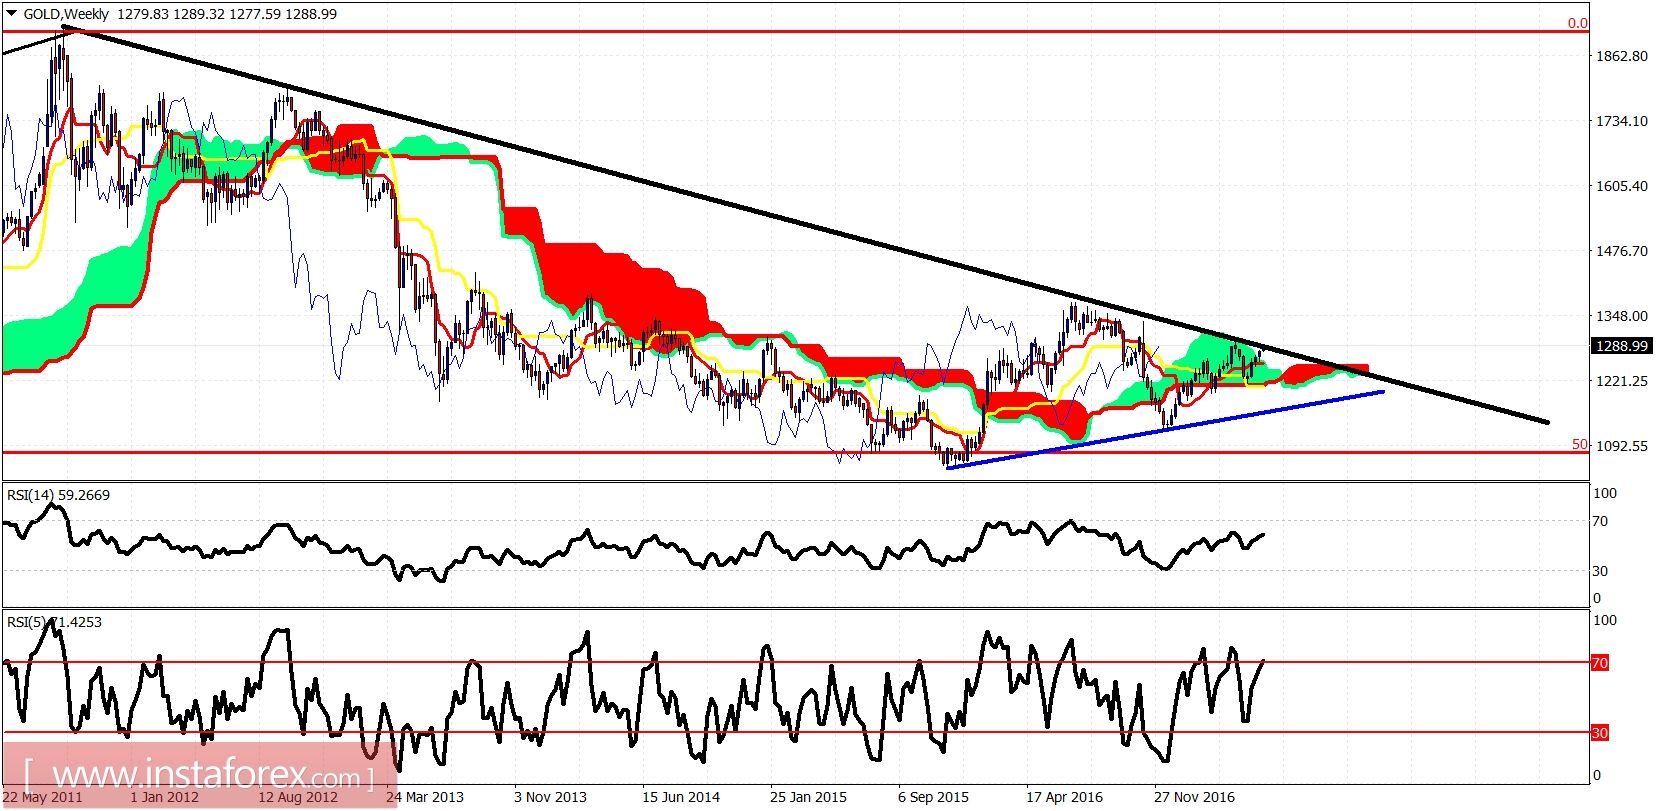
Blue line - long-term trend line support

Gold price is breaking out of the weekly Kumo and is testing the black trend line resistance. I do not expect Gold price to break now above the black trend line or at least make a real breakout. If it breaks out, I would not be buying on strength but wait for a pullback at least towards $1,250. I remain longer-term bullish on Gold.

Analyst InstaForex
Share this article:
parent
loader...
all-was_read__icon
You have watched all the best publications
presently.
We are already looking for something interesting for you...
all-was_read__star
Recently published:
loader...
More recent publications...