


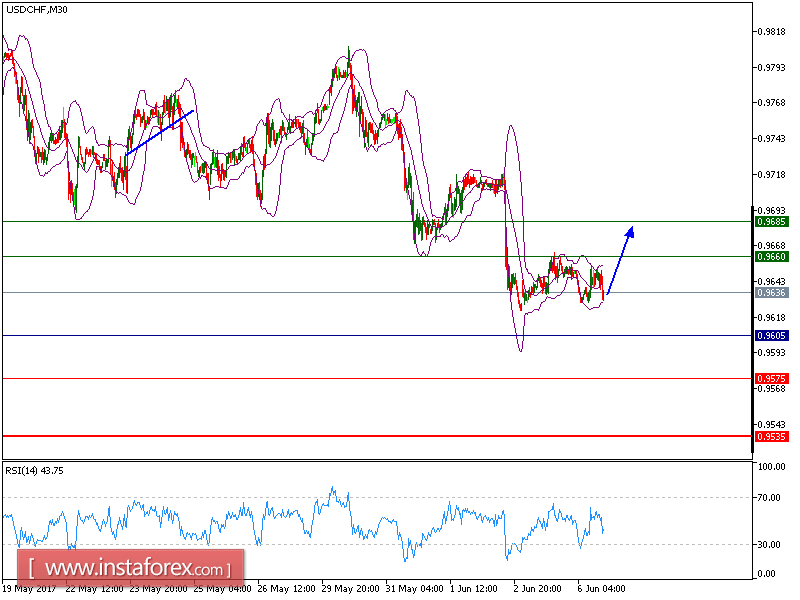
USD/CHF is expected to continue its bounce. The pair bounced off 0.9615 (the low of June 2) and broke above the 50-period moving average. In addition, the 50-period moving average is turning up. The relative strength index lacks downward momentum.
Regarding economic data, the Institute for Supply Management (ISM) said its non-manufacturing activity index fell to 56.9 in May (vs. 57.0 expected) from 57.5 in April. Meanwhile, the Commerce Department reported that factory goods orders dropped 0.2% on month in April (as expected) after jumping 1.0% in March.
Therefore, above 0.9605, expect a technical rebound to 0.9660 and even to 0.9685 in extension.
Graph Explanation: Black line shows the pivot point, present price above pivot point indicates the bullish position and below pivot points indicates the short position. Red lines shows the support levels and green line indicates the resistance levels. These levels can be used to enter and exit trades.
Strategy: Buy at dips, Stop Loss: 0.9605, Take Profit: 0.9660
Resistance levels: 0.9660, 0.9685, and 0.9710
Support levels: 0.9575, 0.9535, and 0.9500


