


The index extended its losses across the markets, with a consolidation ongoing around the support level of 96.53, which is the last barrier before to reach the 96.25 zone. However, as long as USDX doesn't manage to break recent lows, it could be heading towards the 200 SMA at H1 chart around 97.00. MACD indicator remains flat, calling for more sideways.
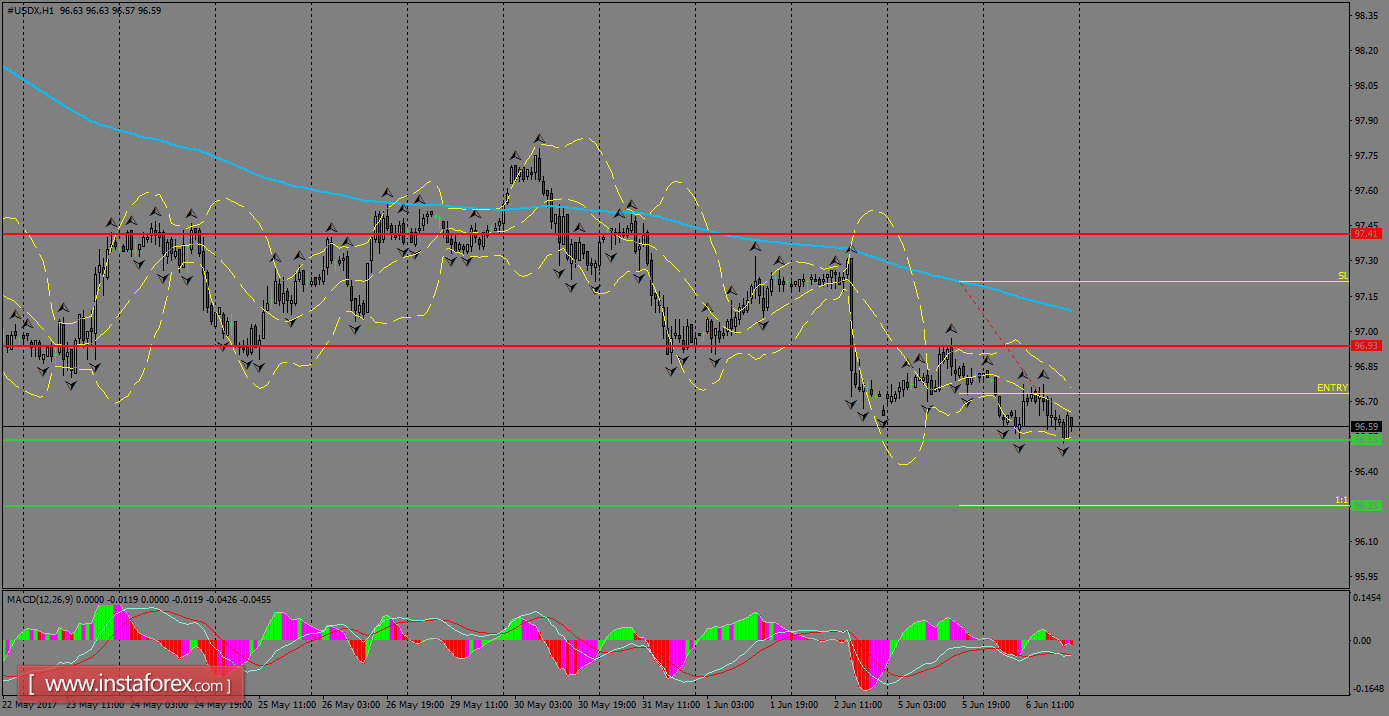
H1 chart's resistance levels: 96.93 / 97.41
H1 chart's support levels: 96.53 / 96.25
Trading recommendations for today: Based on the H1 chart, place sell (short) orders only if the USD Index breaks with a bearish candlestick; the support level is at 96.53, take profit is at 96.25 and stop loss is at 97.21.


