


The Dollar index bounced yesterday as we expected but got rejected at the first important short-term resistance. Yesterday's highs are now very important to the short-term trend. If broken we should expect price to move towards 99.
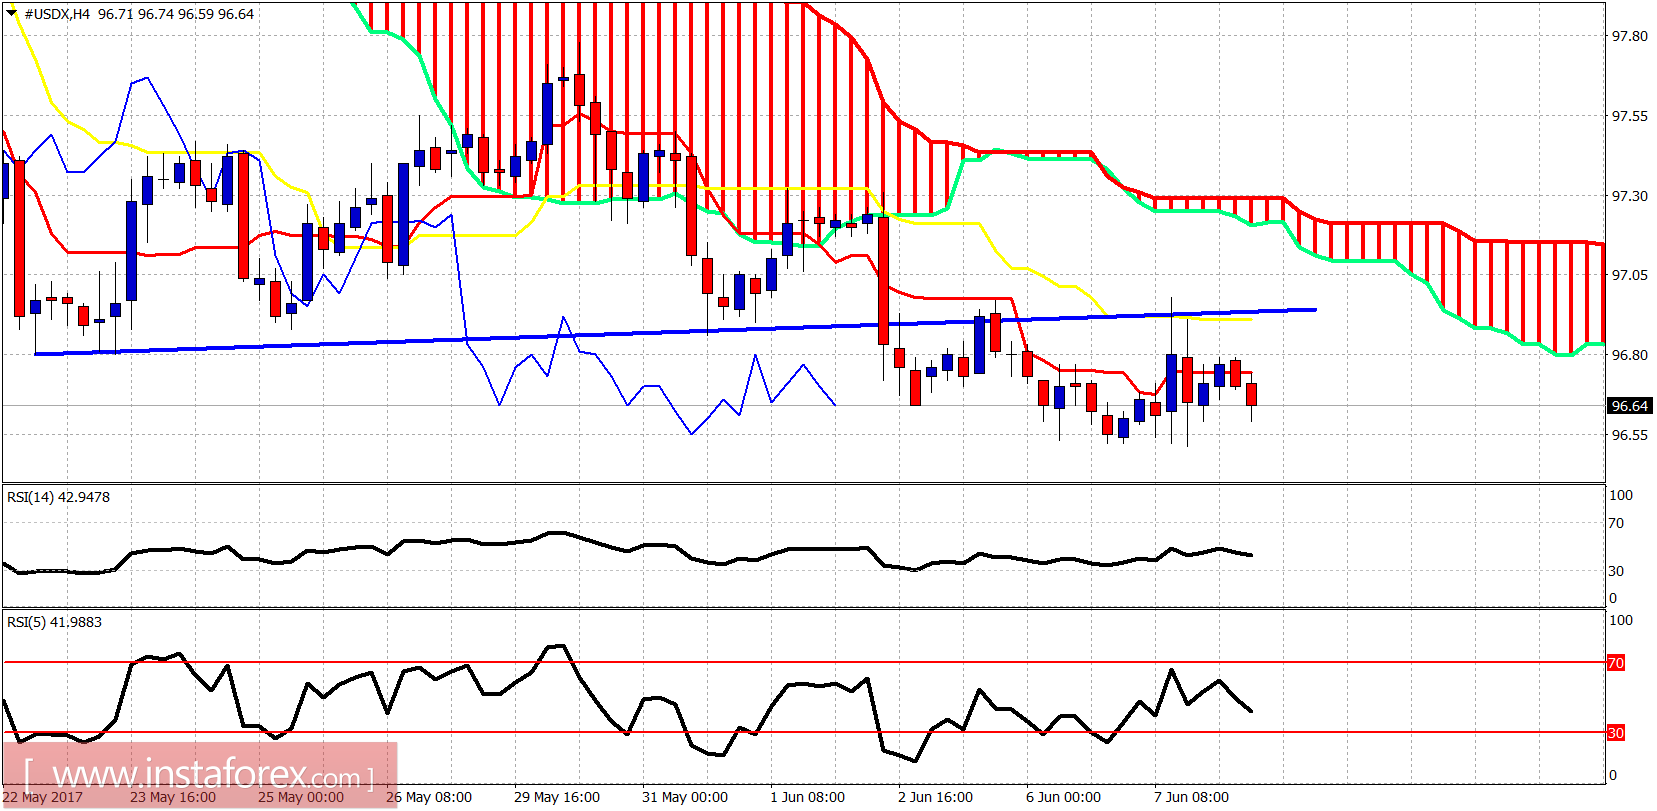
Previous support at 97 has turned into resistance. As expected, the index bounced yesterday and back tested it. However the rejection and inability to hold above 97 is a bearish sign that implies at least one more new lower low could be expected. It is not necessary but as long as we trade below 97, short-term trend remains bearish.
Blue lines - bearish channel
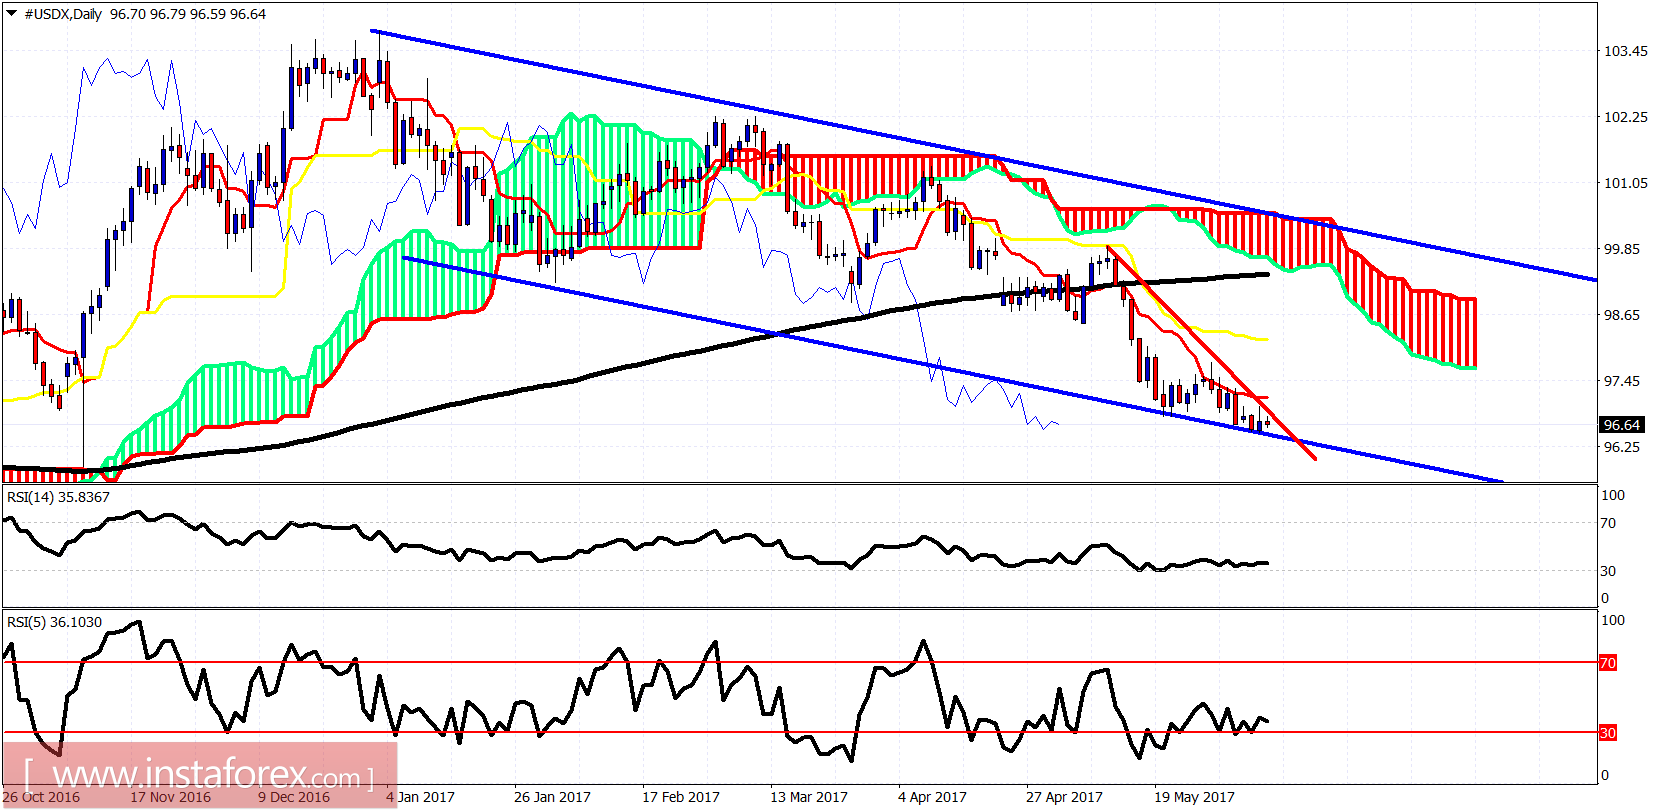
In the daily chart, price is in a bearish trend below both tenkan- and kijun-sen. Price is inside a bearish channel and very close to the lower boundary. I expect a strong bounce to come soon that could push the index back towards the upper channel boundary and the daily Kumo (cloud) resistance at 99. There are bullish divergence signs by the RSI and this is a warning for Dollar bears to be cautious and lower their stops.


