


The index found support around the 200 SMA at H1 chart as the greenback was under selling pressure in Monday's session. If USDX manages to recover above the resistance zone of 97.41, then it can rally towards 97.75 in a first degree, but the downside continuation is still a high possibility. MACD indicator is turning neutral to negative, favoring further weakness.
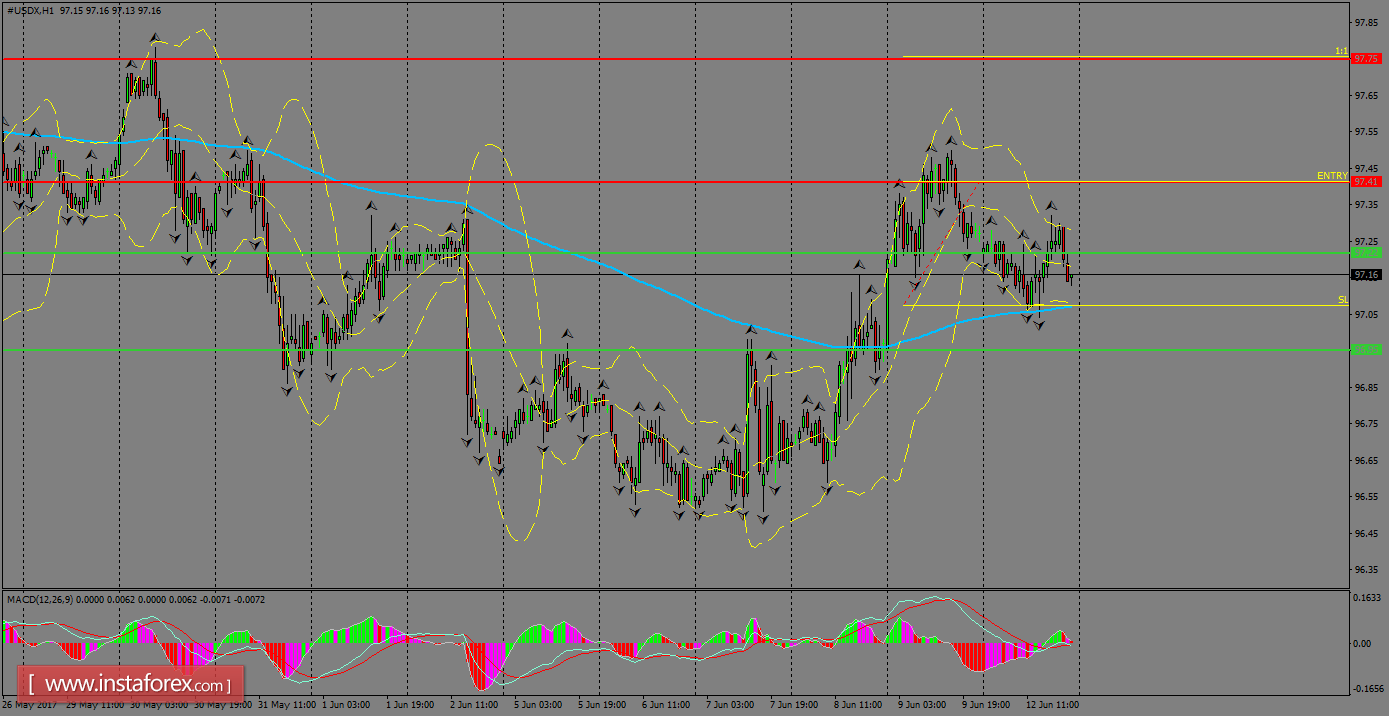
H1 chart's resistance levels: 97.41 / 97.75
H1 chart's support levels: 97.22 / 96.95
Trading recommendations for today: Based on the H1 chart, place buy (long) orders only if the USD Index breaks with a bullish candlestick; the resistance level is at 97.41, take profit is at 97.75 and stop loss is at 97.07.


