


Gold price got rejected off resistance yesterday and is now making new lows. I still expect Gold price to move towards $1,250-45 over the coming days before any upward reversal. I remain long-term bullish looking for $1,400-$1,500.
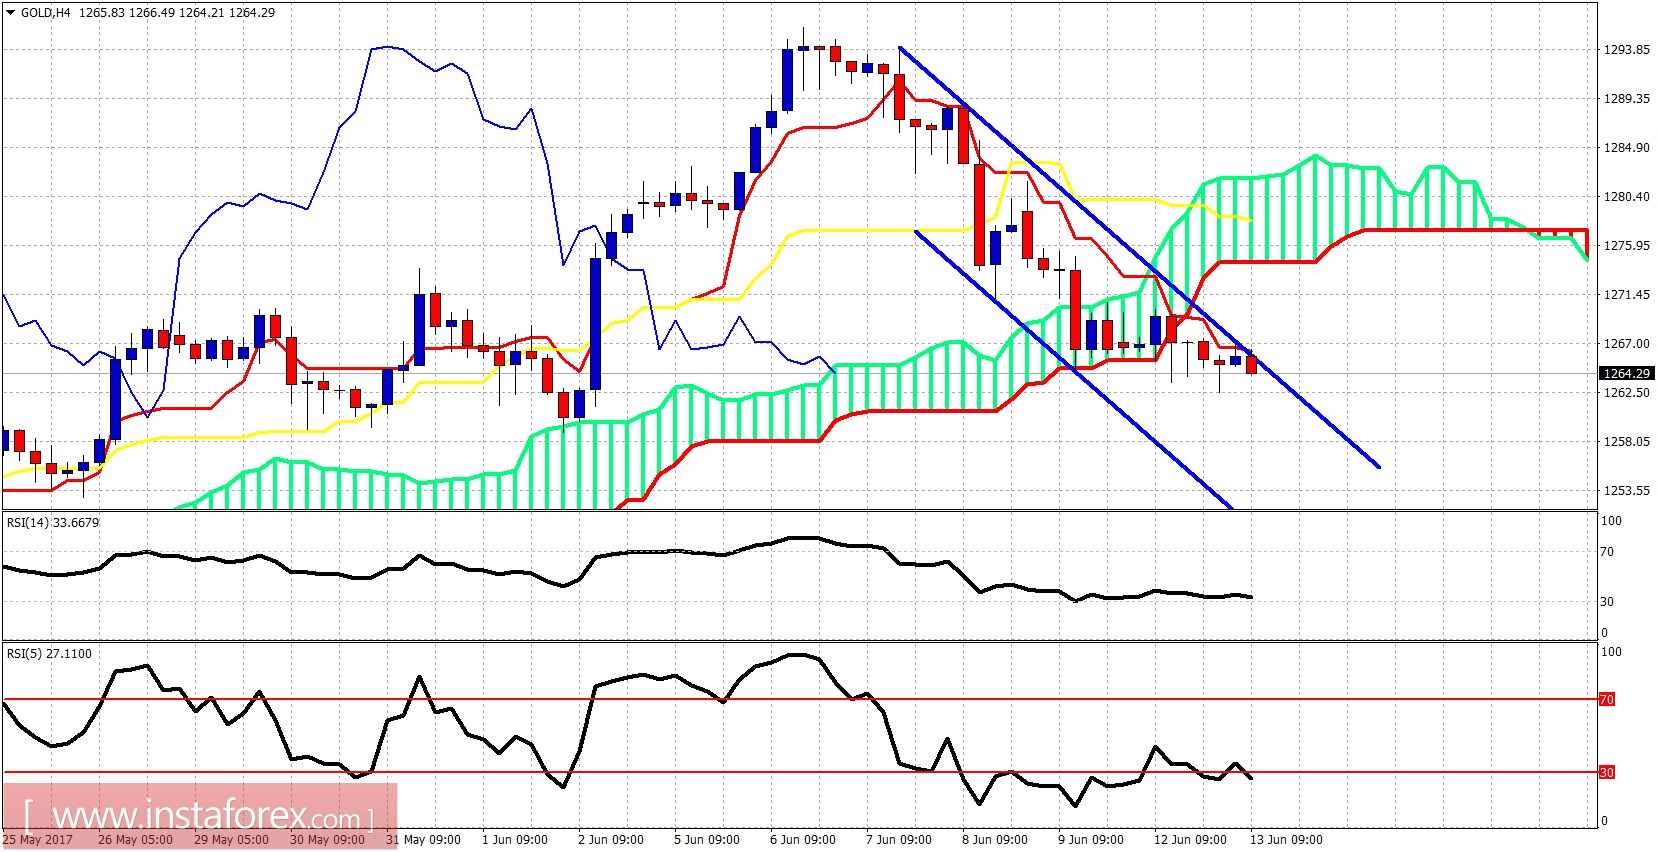
Blue lines - bearish channel
Gold price remains inside the bearish channel and has broken below the 4-hour Kumo (cloud). Trend is bearish. Support is at $1,250-45. Resistance is at $1,270 and next at $1,277.
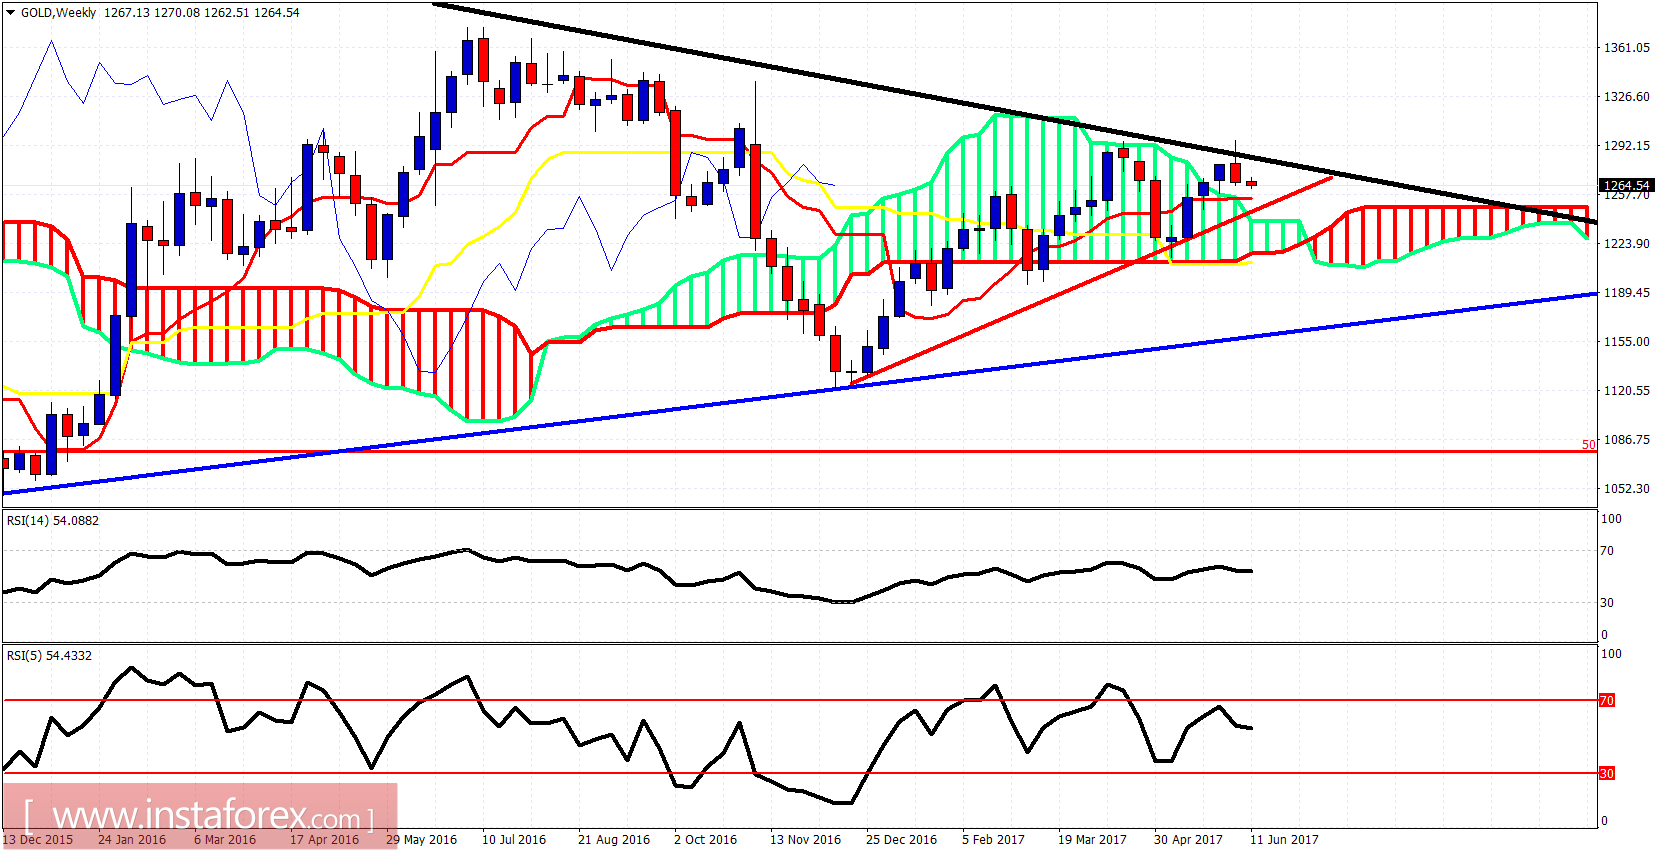
Black line - Long-term resistance
Blue line - long-term support
Gold weekly chart shows price pulling back off the long-term trend line resistance at $1,300 as we expected last week. This was not the time to break upwards. After this pullback is completed, we should be ready for a big breakout. Important to hold above the weekly cloud at $1,208. I remain longer-term bullish waiting for $1,250-45 to re-enter long.


