


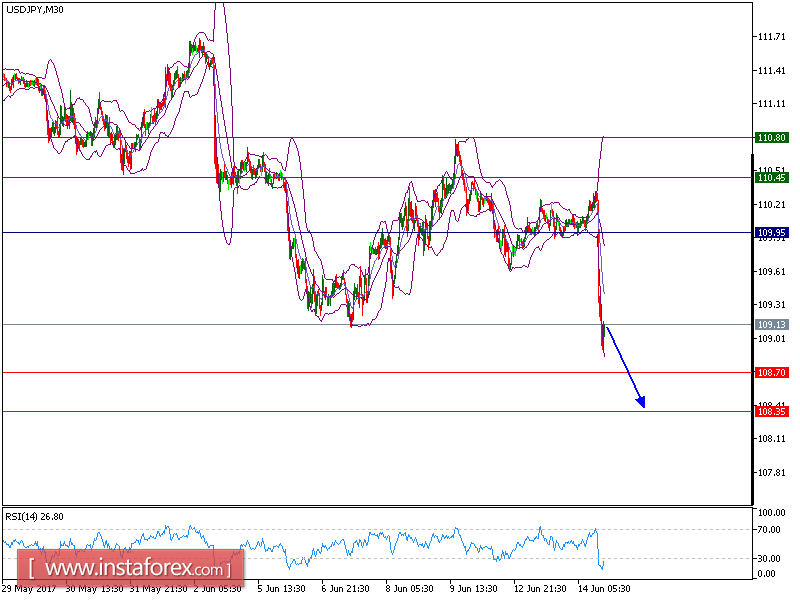
As it was predicted in the yesterday analysis, USD/JPY has moved is same direction and both our take profits targets have been hit. USD/JPY is still under pressure and expected to post further losses. The pair broke below the 20-period and 50-period moving averages. In addition, the 20-period moving average is turning down and is about to cross below the 50-period one. The relative strength index is heading downwards.
To conclude, as long as 109.95 holds on the upside, look for a further drop to 108.70 and even to 108.35 in extension.
Alternatively, if the price moves in the opposite direction as predicted, long position is recommended above 109.95 with targets at 108.70.
Chart Explanation: The black line shows the pivot point, present price above pivot point indicates the bullish position and below pivot points indicate the short position. The red lines show the support levels and the green line indicates the resistance levels. These levels can be used to enter and exit trades.
Strategy : SELL, Stop Loss: 110.45, Take Profit: 109.65
Resistance levels: 110.45, 110.80, and 111.15
Support levels: 108.70,108.35, and 108


