Main Quotes Calendar Forum
flag

FX.co ★ Ichimoku indicator analysis of gold for June 19, 2017

parent
Forex Analysis:::2017-06-19T07:12:42

Ichimoku indicator analysis of gold for June 19, 2017

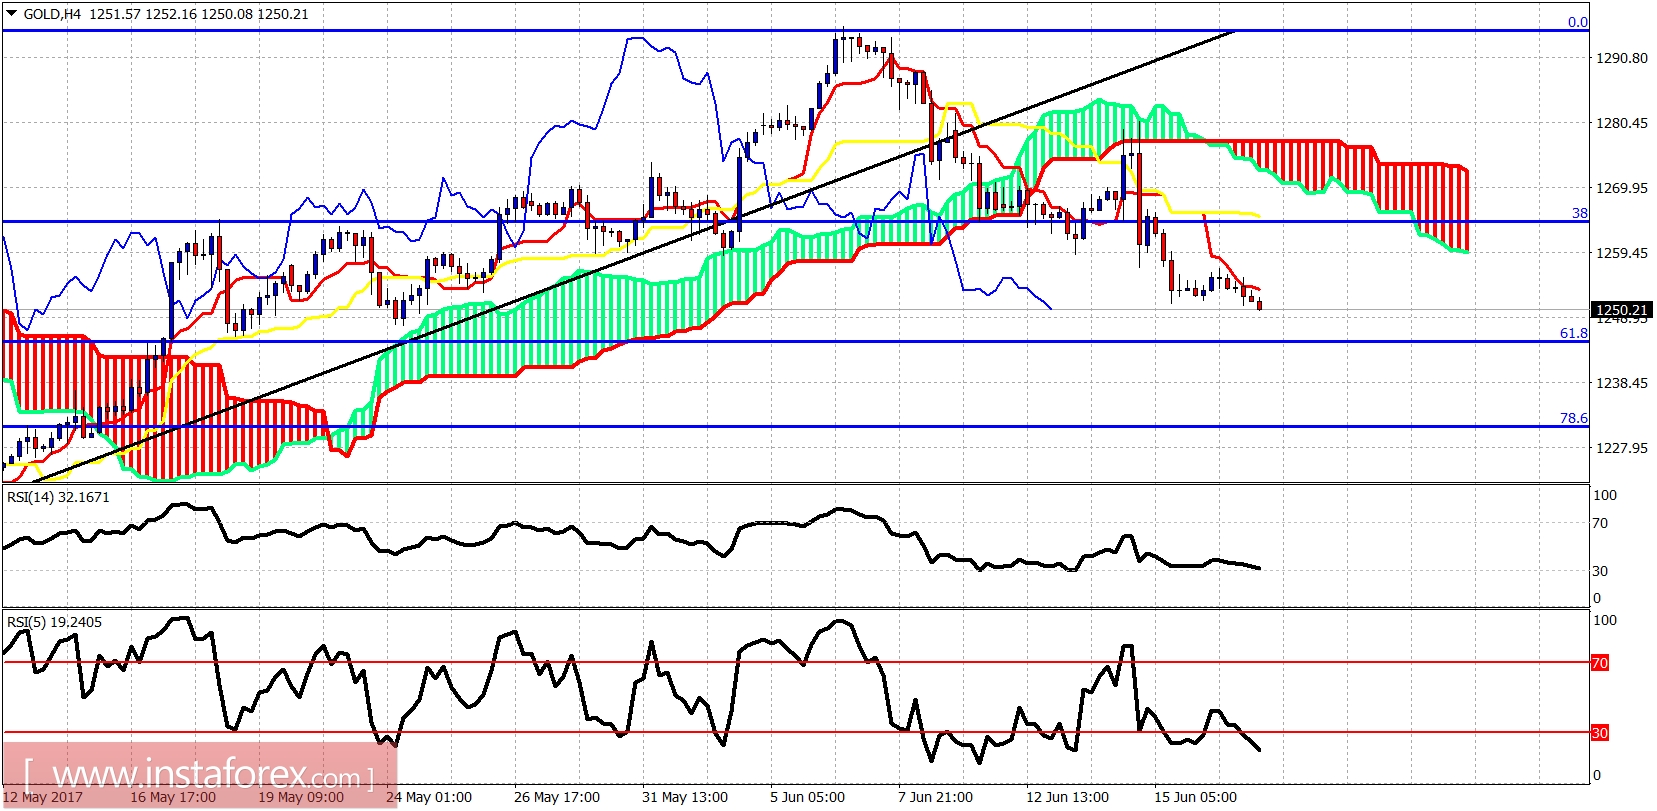
Gold price is breaking short-term support and is heading towards our target of $1,245. Gold weakness is expected for the start of the week but overall I can see a bigger longer-term upward reversal coming soon.

Ichimoku indicator analysis of gold for June 19, 2017

Gold price is making lower lows and lower highs. Price is approaching the 61.8% Fibonacci retracement of the latest rise and this is important support. If we break below $1,245 we should expect Gold price to go towards $1,230. Trend remains bearish in the shortterm and the Gold pullback is unfolding as we expected from $1,280.

Ichimoku indicator analysis of gold for June 19, 2017

Black line - long-term resistance trend line

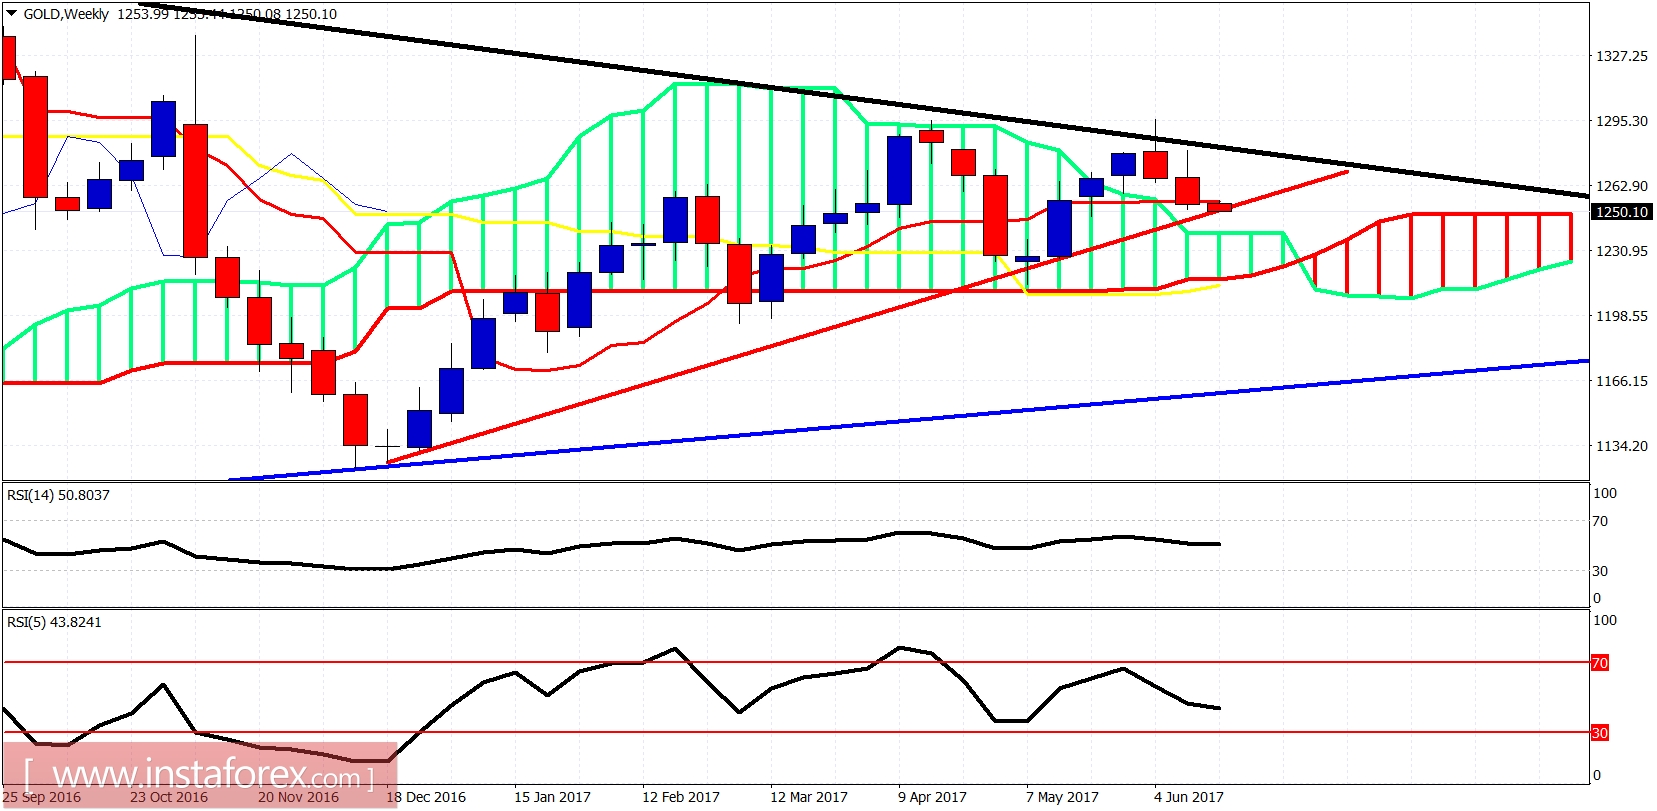
Red line - support trend line

Blue line - long-term support trend line

The Gold weekly chart as expected is moving towards the weekly Kumo (cloud) support at $1,235-45 area. The rejection unfolded as we expected two weeks ago at $1,295. Now we prepare for a longer-term reversal. I expect Gold to reverse upwards from the $1,200-$1,245 area. I remain longer-term bullish.

Analyst InstaForex
Share this article:
parent
loader...
all-was_read__icon
You have watched all the best publications
presently.
We are already looking for something interesting for you...
all-was_read__star
Recently published:
loader...
More recent publications...