


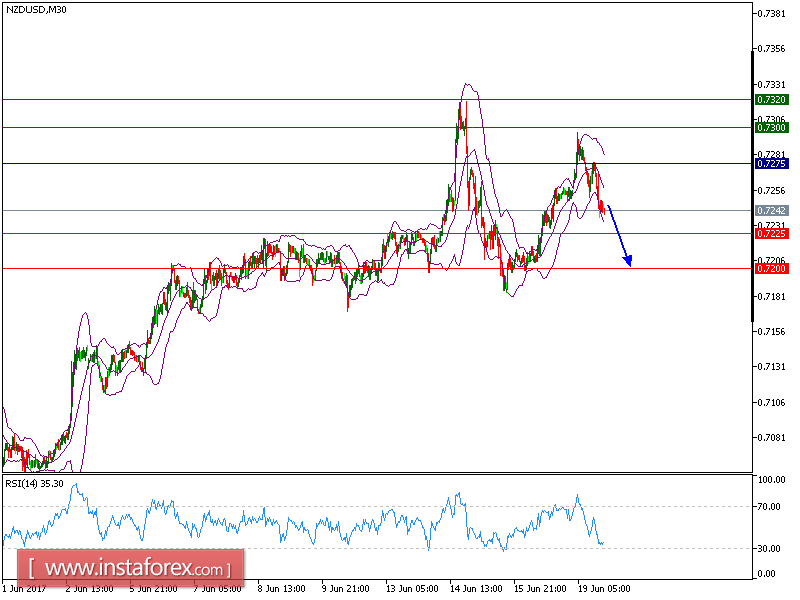
As predicted, NZD/USD hit our take profit and touched 0.7280. Now it is expected to turn down. Although the pair posted a rebound and broke above the 20-period and 50-period moving averages, it is still trading below the key resistance at 0.7275 which should limit the upside potential. Even though a continuation of technical rebound cannot be ruled out, its extent should be limited.
Hence, as long as 0.7275 is not surpassed, expect a return to 0.7225 and even to 0.7200 in extension.
Strategy: SELL. Stop Loss: 0.7275. Take Profit: 0.7300
Chart Explanation: The black line shows the pivot point. Currently, the price is above the pivot point which indicates the bullish position. If it is below the pivot points, it indicates the short position. The red lines show the support levels and the green line indicates the resistance levels. These levels can be used to enter and exit trades.
Resistance levels: 0.7300, 0.7320, and 0.7355
Support levels: 0.7225, 0.7200, and 0.7160


