


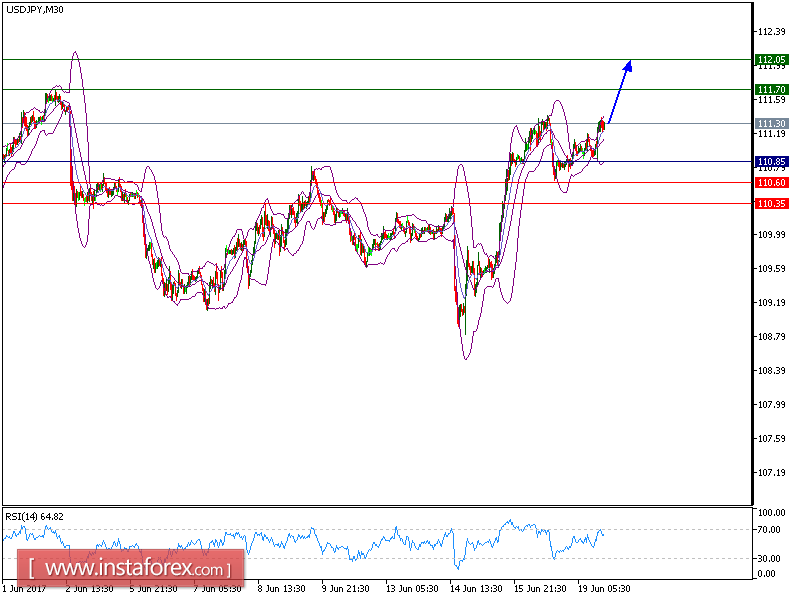
USD/JPY is expected to move with bullish bias above 110.85. Although the pair posted a pullback, it is still trading above the key support at 110.85, which should limit the downside potential. Even though a continuation of the consolidation cannot be ruled out, its extent should be limited.
To conclude, as long as 110.85 is not broken, look for a further rise to 111.70. A break above this level would trigger a new upside to 112.05.
Alternatively, if the price moves in the opposite direction as predicted, short position is recommended below 110.85 with targets at 110.60 and 110.35.
Chart Explanation: The black line shows the pivot point. The present price above pivot point indicates the bullish position while the price below pivot points indicates the short position. The red lines show the support levels and the green line indicates the resistance levels. These levels can be used to enter and exit trades.
Strategy : BUY, Stop Loss: 110.85, Take Profit: 111.70
Resistance levels: 111.70, 112.05, and 112.45
Support levels: 110.60,110.35, and 110.00


