


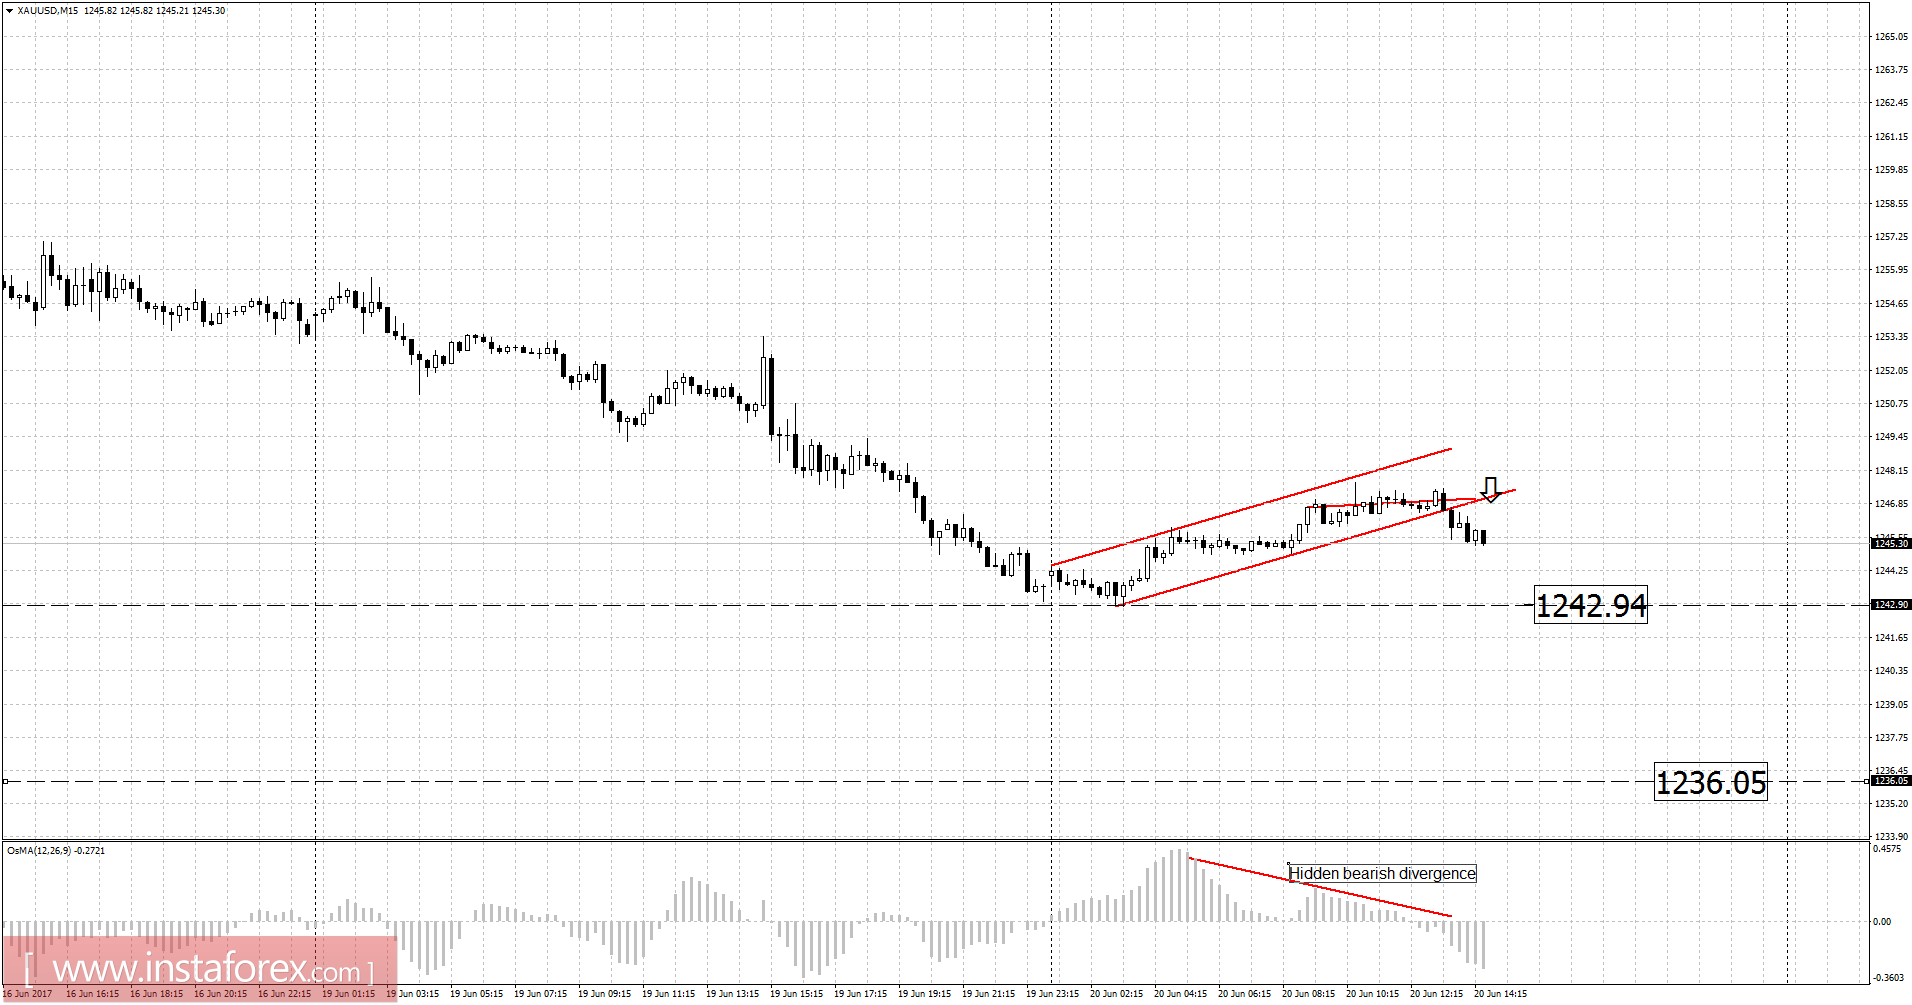
Recently, the Gold has been trading sideways at the price of $1,245.00. According to the 15M time frame, I found broken bearish flag and hidden bearish divergence on the moving average oscillator, which is a sign that buying looks risky. The short- term trend is bearish. My advice is to watch for potential selling opportunities today. Downward targets are set at the price of $1,243.00 and $1,236.00.
Resistance levels:
R1: $1,245.50
R2: $1,262.45
R3: $1,267.50
Support levels:
S1: $1,241.00
S2: $1,236.00
S3: $1,228.55
Trading recommendations for today: watch for potential selling opportunities.


