


The US dollar index is reversing higher. The short-term trend is bullish as price has broken above the 97.50 short-term resistance and is trying to break above a multi-week sideways consolidation.
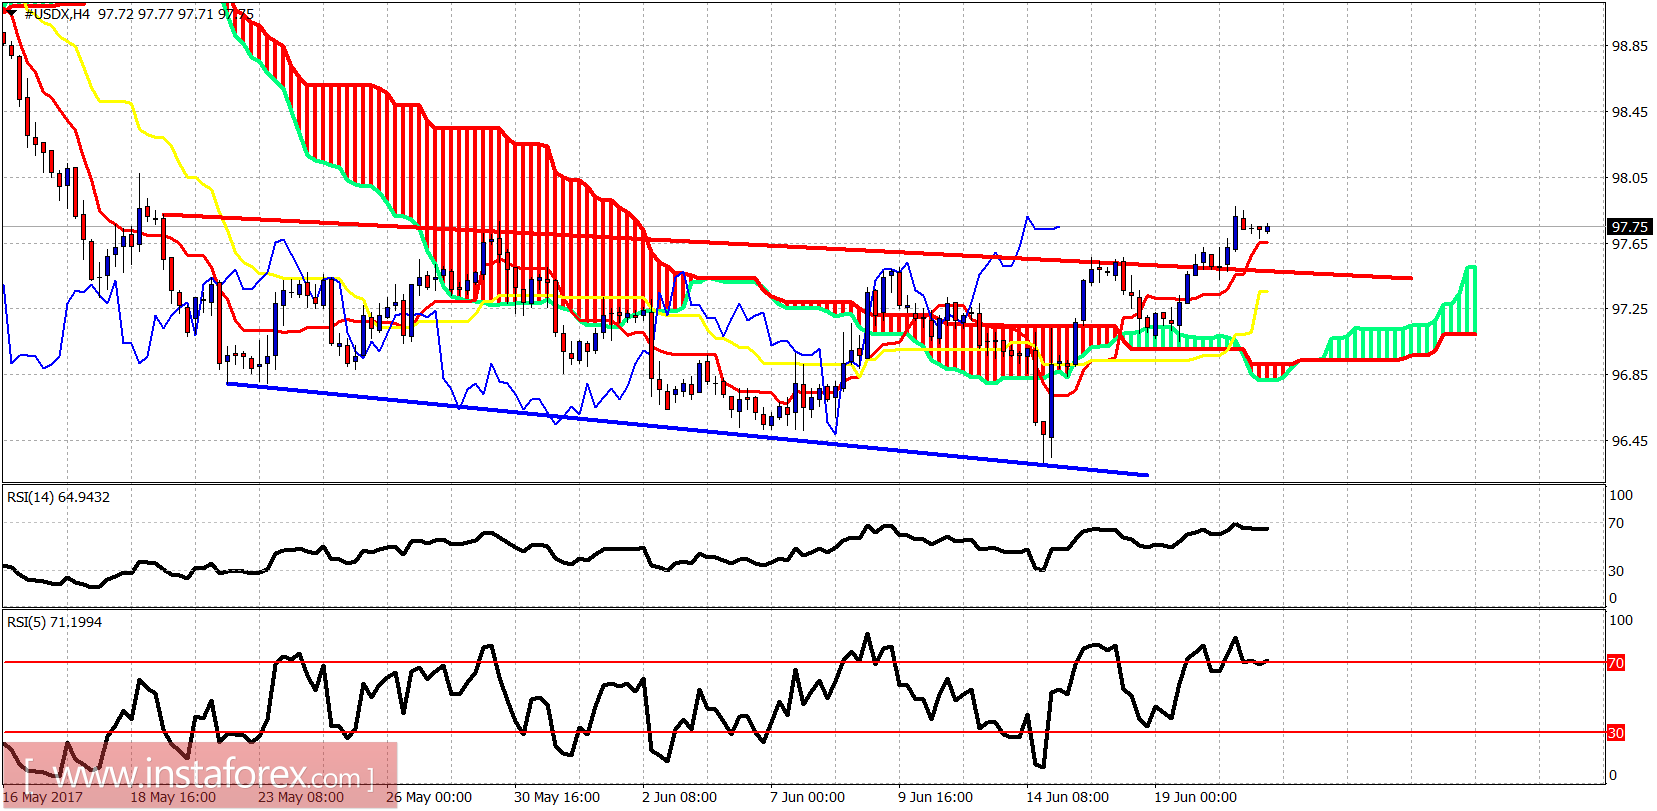
Blue line - support
USDX is making higher highs and higher lows. Price has broken above the red trend line resistance and is trading above both the tenkan- and kijun-sen indicators. The trend is bullish. Short-term support is found at the 4-hour Kumo at 97.
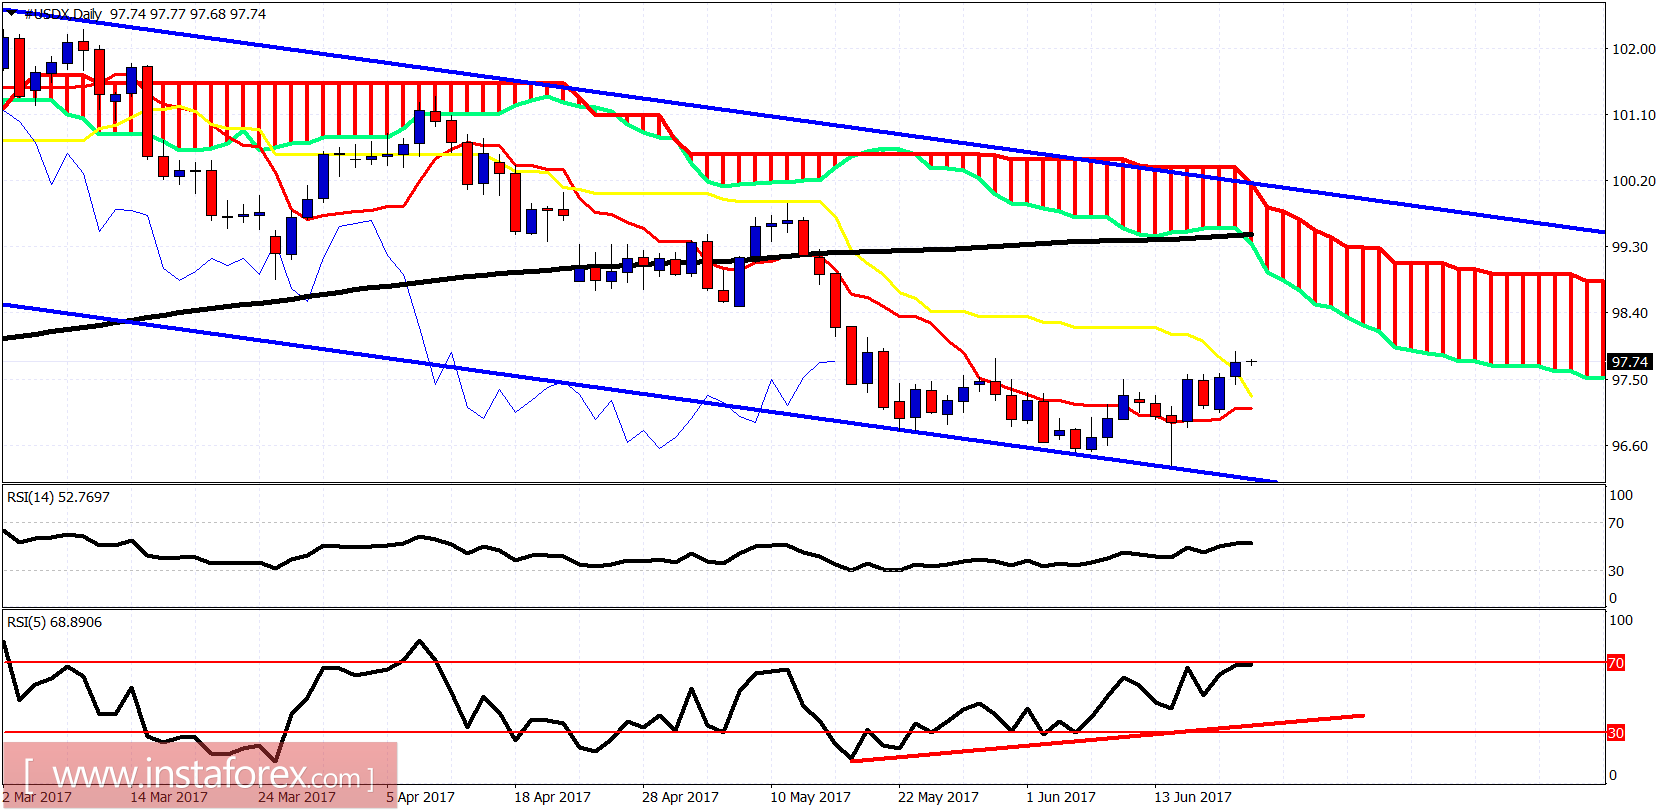
Red line - bullish divergence
The daily chart confirms our bullish expectations. The bullish divergence has warned us that a bounce was coming. Price has broken above the kijun-sen and is heading towards the Daily Kumo at 98.50 or even the upper channel boundary at 99. I warned dollar bears to protect their positions. This was not the time to be bearish in this market. Only after a bounce towards our target we will look to sell again.


