


The index had a retracement during Friday's session and the support zone of 97.10 could be challenged in coming hours. We're still following the bullish idea for the US Dollar Index, as the price isn't so far from the 200 SMA area at H1 chart. If USDX manages to break above 97.43, then it can reach the 97.84 level. MACD indicator is turning flat, calling for sideways' price action in the short-term.
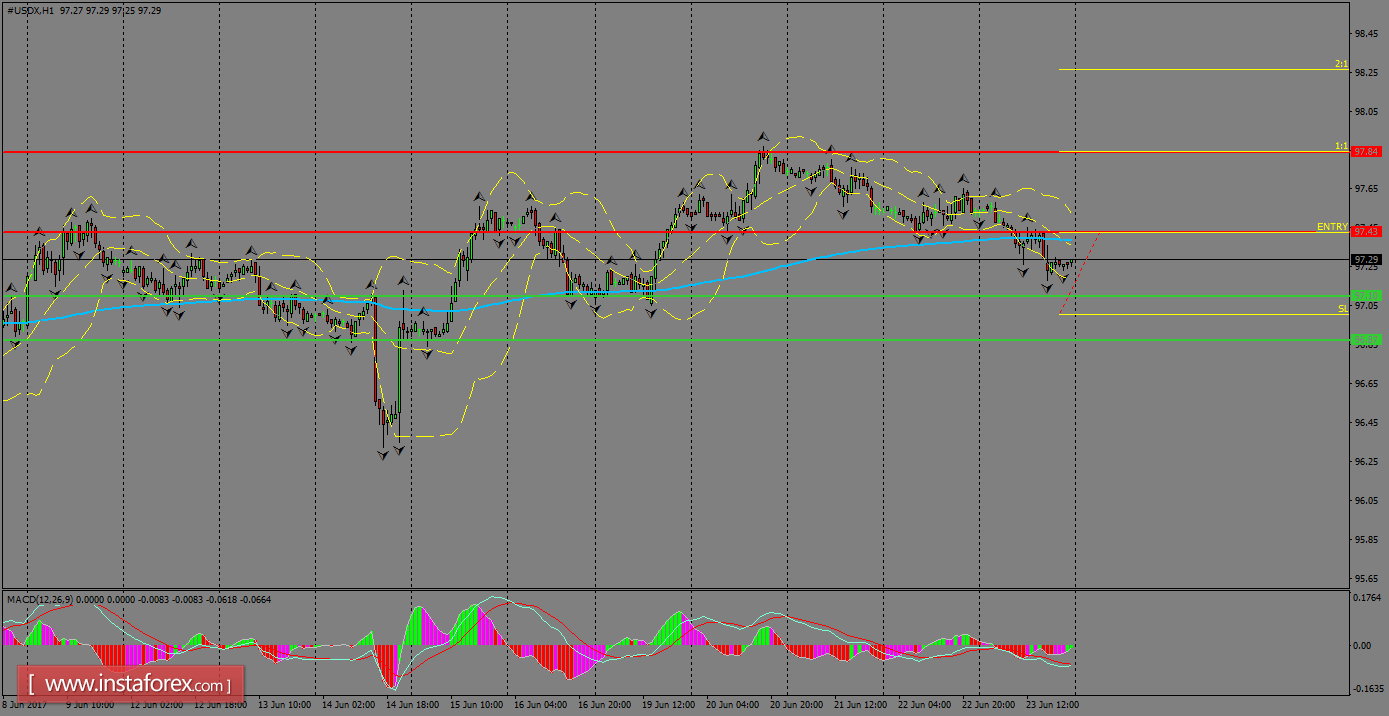
H1 chart's resistance levels: 97.43 / 97.84
H1 chart's support levels: 97.10 / 96.87
Trading recommendations for today: Based on the H1 chart, place buy (long) orders only if the USD Index breaks with a bullish candlestick; the resistance level is at 97.84, take profit is at 98.98 and stop loss is at 97.51.


