


Gold price remains in a bearish trend as long as price is below $1,260. Gold has made a double top rejection at $1,300 and this opens up the possibility of a break lower towards $1,200-$1,180.
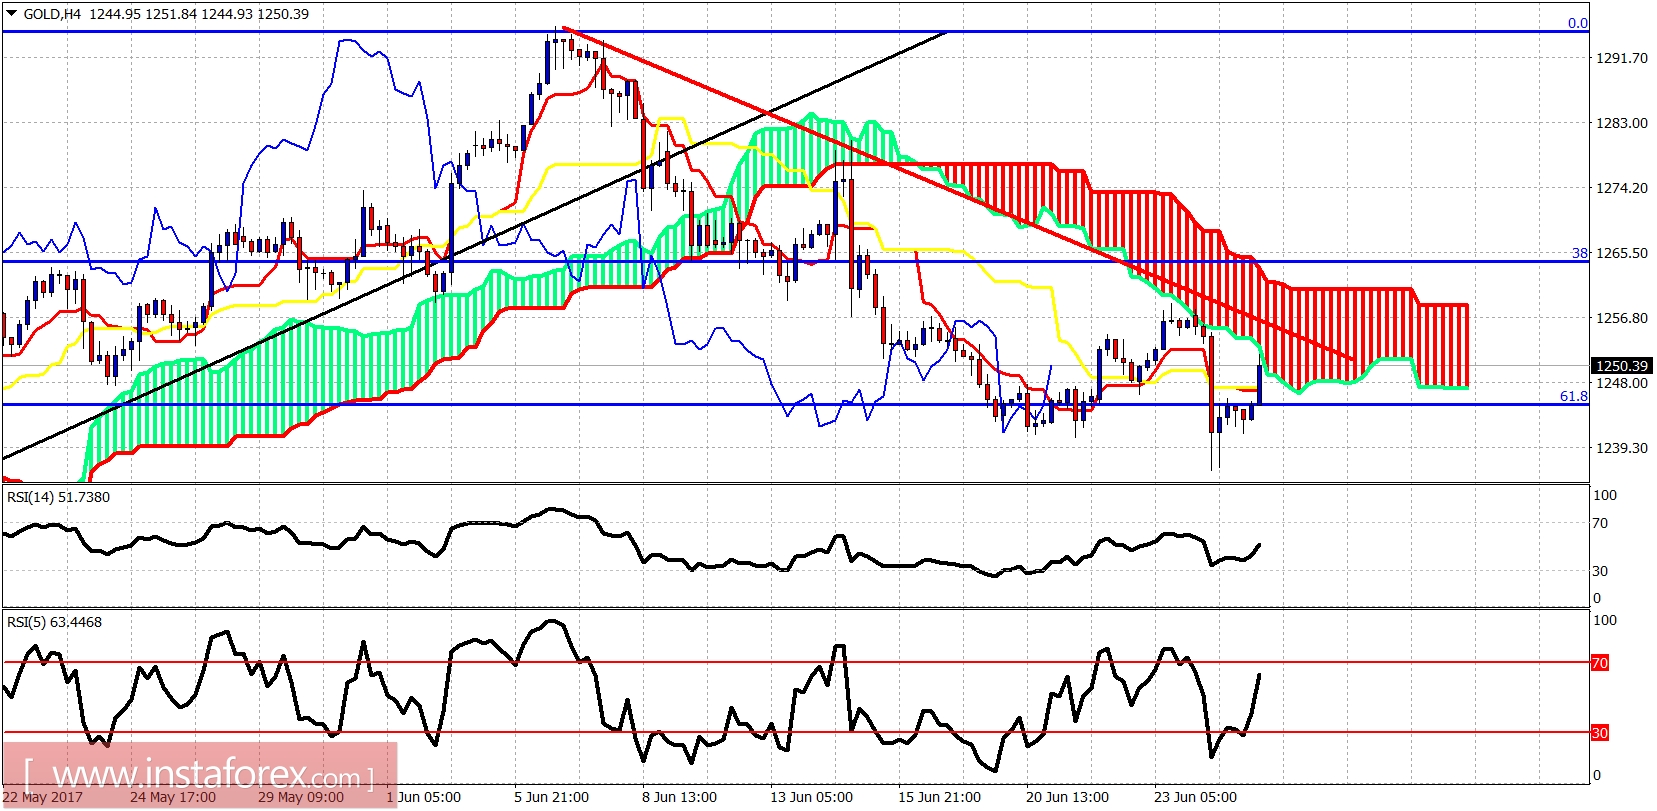
Gold price is trading below both the red trend line and the 4-hour Kumo. Short-term trend is clearly bearish. Short-term resistance and trend change level is at $1,260. Support is at $1,240.
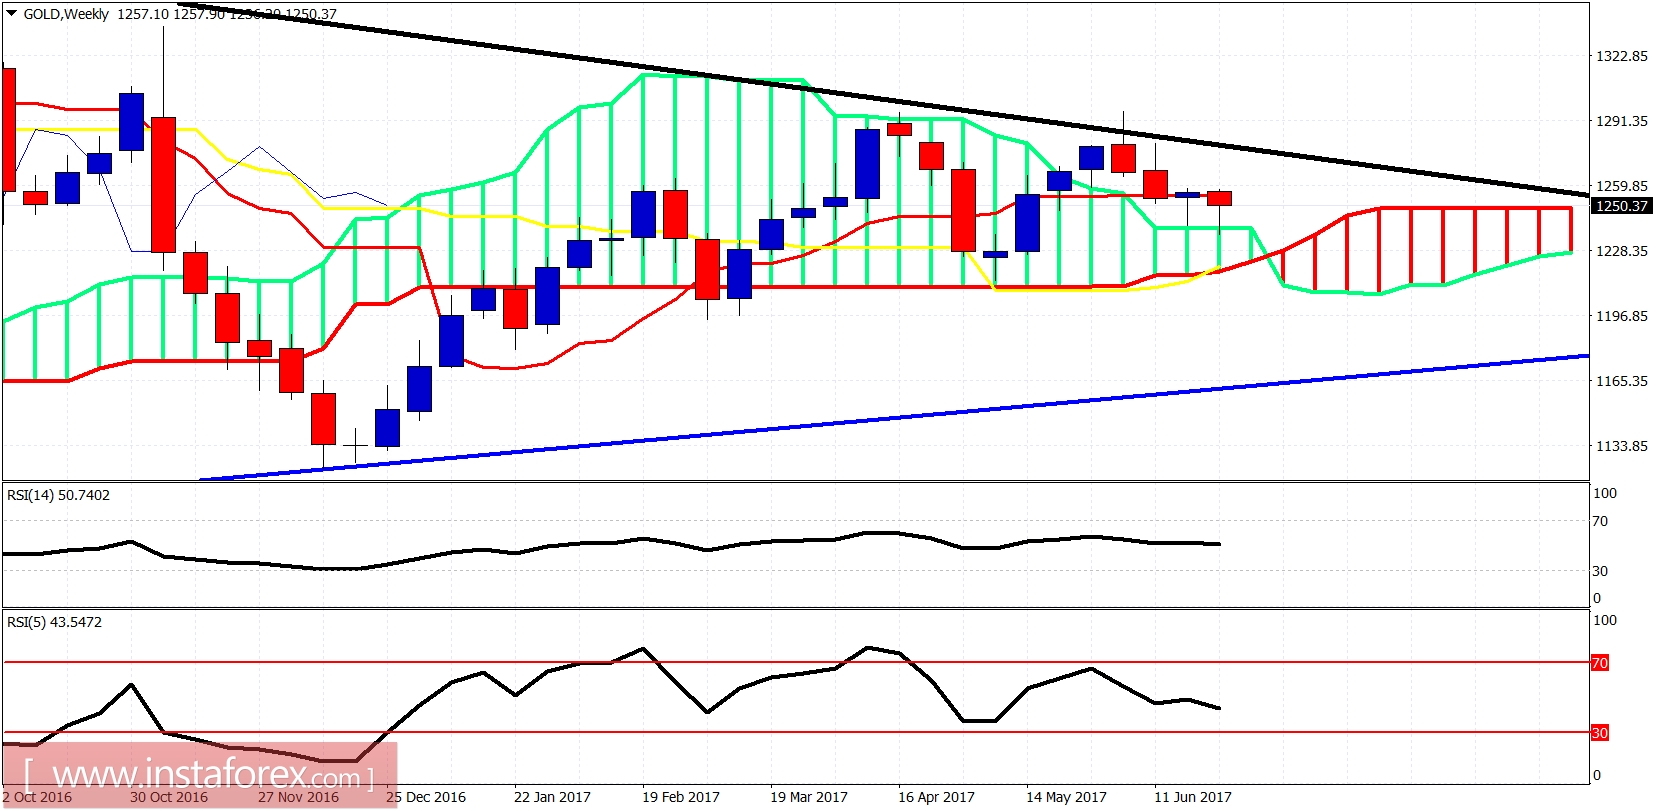
Blue line - long-term support
Another weekly candle where we see a tail is touching the weekly cloud support and bouncing upwards. Price is holding at support for now. A weekly breakout towards our longer-term targets will be confirmed on a break above the black long-term trend line. The double top at $1,300 could however push us first towards the blue trend line before the next leg up.


