Main Quotes Calendar Forum
flag

FX.co ★ Ichimoku indicator analysis of USD/JPY for June 28, 2017

parent
Forex Analysis:::2017-06-28T07:51:55

Ichimoku indicator analysis of USD/JPY for June 28, 2017

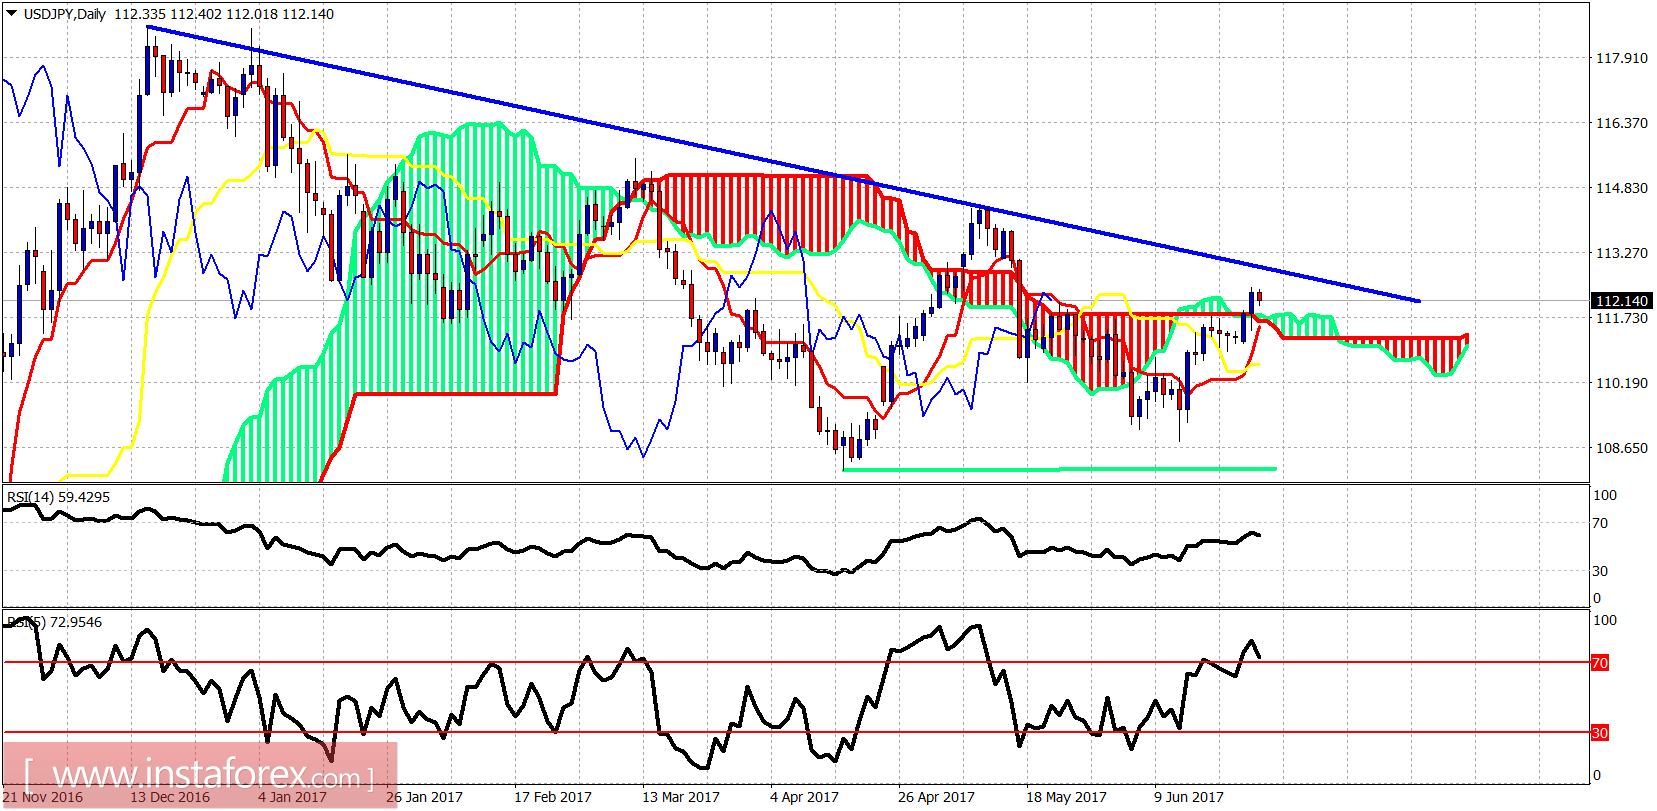
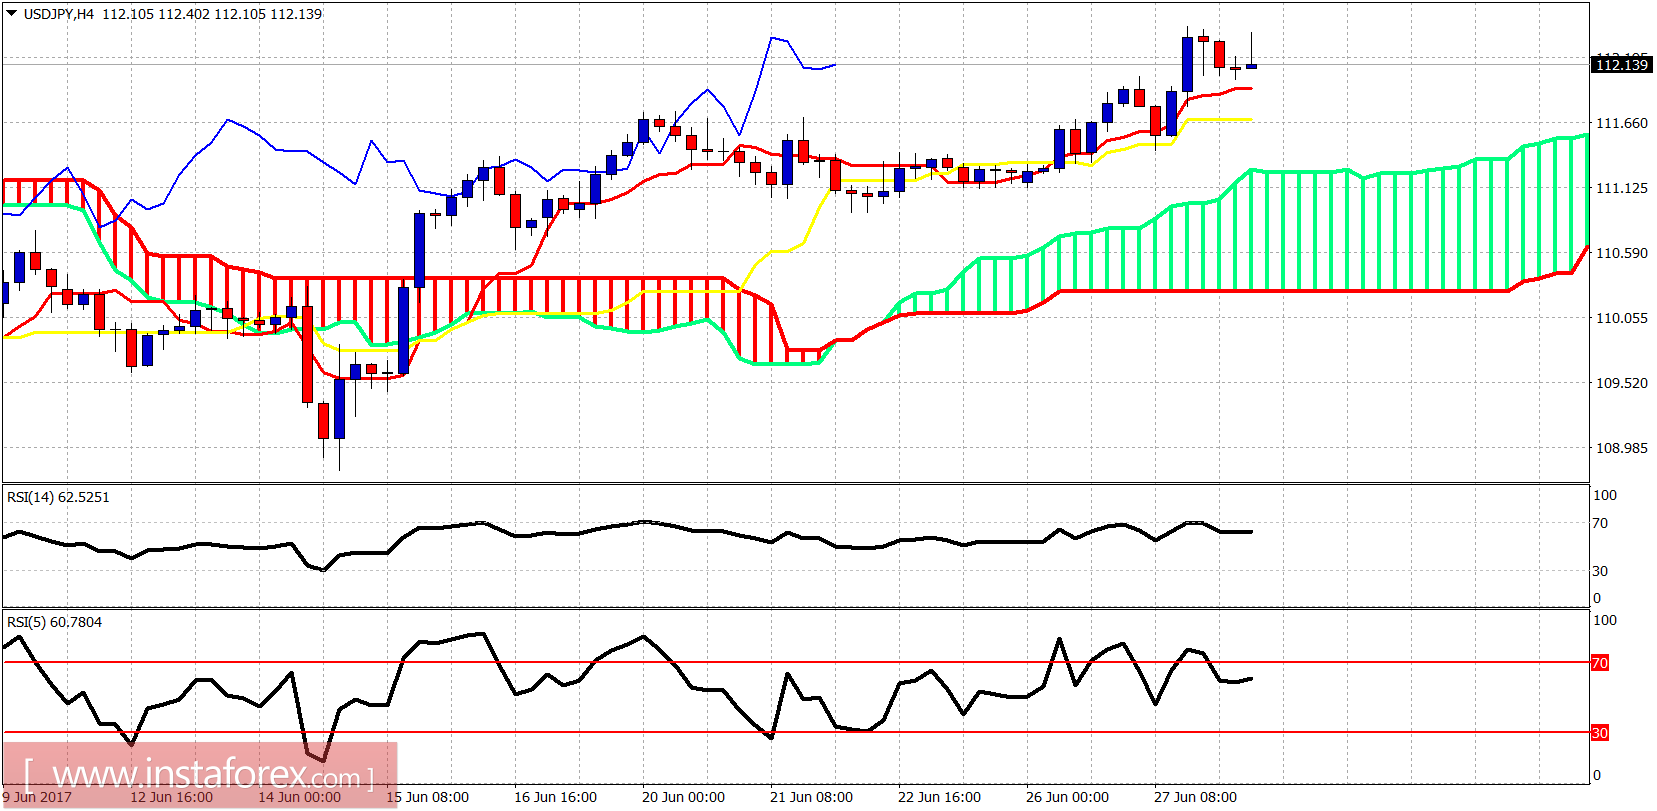
The USD/JPY pair rallied yesterday from 111.50 to 112.50 where we previously mentioned that this is important resistance area. USD/JPY could reach 112.85 where the blue trend line resistance from the previous highs is found.

Ichimoku indicator analysis of USD/JPY for June 28, 2017

Price has broken out of the cloud but will have to stay above it and break above the blue trend line in order for the trend to remain bearish. Important daily support is at 111.70. If this support level is lost, we should expect prices to fall hard and start a new downward move to 104.

Ichimoku indicator analysis of USD/JPY for June 28, 2017

In the 4-hour chart price remains above the tenkan- and kijun-sen. Trend is bullish. Support is at 111.95 and at 111.70. Breaking below these two levels will also change short-term trend to bearish.
Analyst InstaForex
Share this article:
parent
loader...
all-was_read__icon
You have watched all the best publications
presently.
We are already looking for something interesting for you...
all-was_read__star
Recently published:
loader...
More recent publications...