


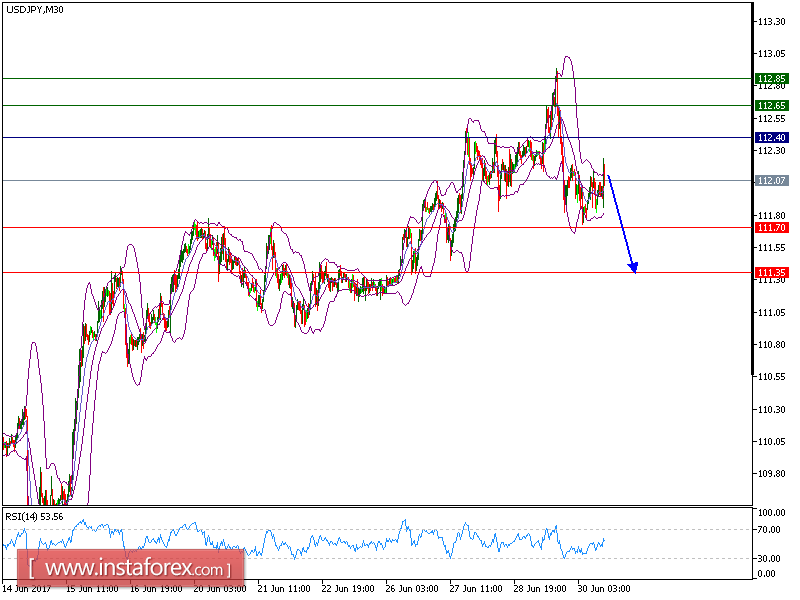
USD/JPY is expected to trade with a bearish outlook. The pair retreated from 112.90 (the high of June 29) and broke below both 20-period and 50-period moving averages. In addition, the 20-period moving average crossed below the 50-period one. The relative strength index is bearish and is calling for a further drop.
Hence, as long as 112.40 is resistance, look for a further drop to 111.70 and even to 111.35 in extension.
Alternatively, if the price moves in the opposite direction as predicted, LONG position is recommended below 111.70 with targets at 112.65 and 112.85.
Chart Explanation: The black line shows the pivot point. The present price above pivot point indicates the bullish position while the price below pivot point indicates the short position. The red lines show the support levels and the green line indicates the resistance levels. These levels can be used to enter and exit trades.
Strategy : SELL, Stop Loss: 112.40, Take Profit: 111.70
Resistance levels: 112.65, 112.85, and 113.25
Support levels: 111.70,111.35, and 111.00


