


Our upside target for USD/JPY which we predicted in yesterday's analysis has been hit. The pair is still expected to trade with a bullish outlook. Although the pair broke below the 20-period moving average, it is still trading above the rising 50-period moving average, which plays a support role. The downside potential should be limited by the key support at 112.80.
Therefore, as long as 112.80 holds on the downside, look for a new rebound to 112.65 and even to 112.92 (the high of June 29) in extension.
Alternatively, if the price moves in the opposite direction as predicted, a short position is recommended below 112.80 with a target at 113.45.
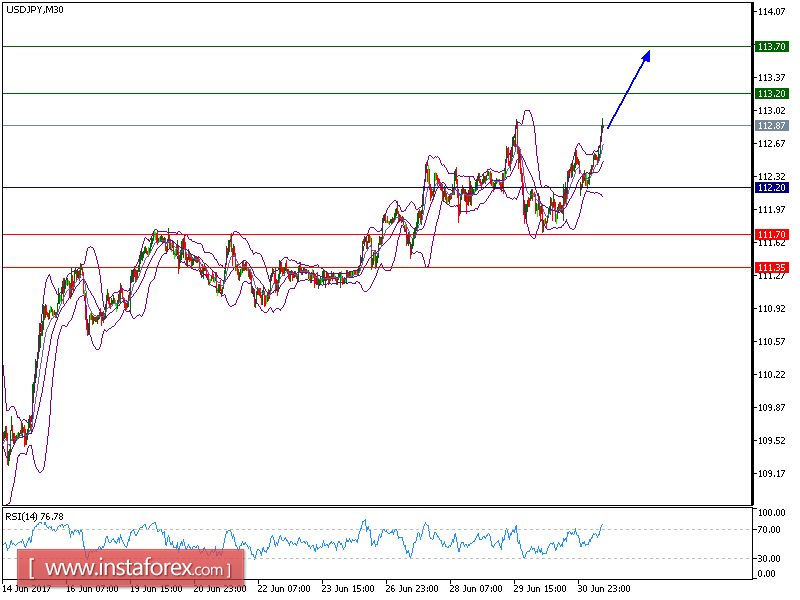
Chart Explanation: The black line shows the pivot point. The current price above the pivot point indicates a bullish position while the price below the pivot point is a sign for a short position. The red lines show the support levels and the green line indicates the resistance level. These levels can be used to enter and exit trades.
Strategy : BUY, Stop Loss: 112.80, Take Profit: 113.45
Resistance levels: 113.45, 113.70, and 114.05
Support levels: 112.40,111.15, and 110.75


