


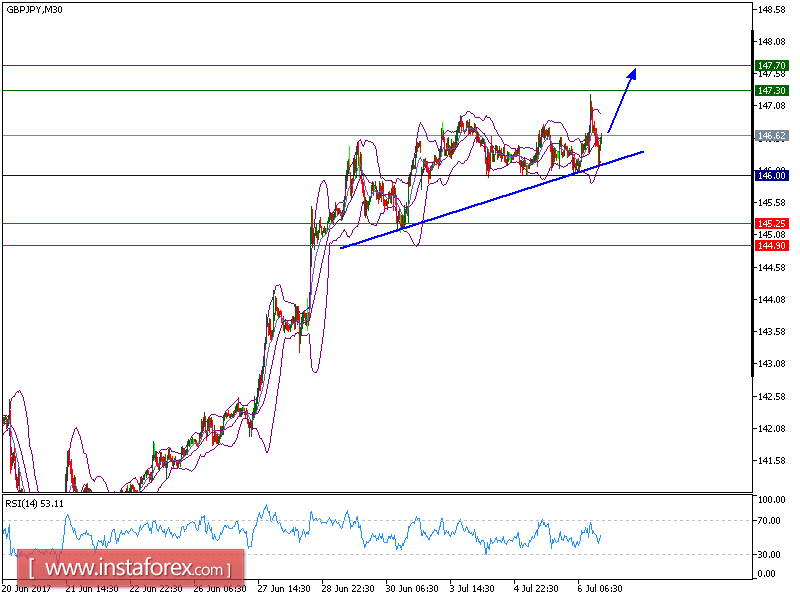
As predicted, our take profit target of GBP/JPY has been hit. GBP/JPY is still trading above its trend line. The pair posted a rebound at 146.00 and broke above both 20-period and 50-period moving averages. In addition, the 20-period moving average is turning up and is playing a support role. The relative strength index is above its neutrality level at 50.
To conclude, as long as 146.00 is not broken, look for a further rebound with targets at 47.30 and 147.70 in extension.
Alternatively, if the price moves in the opposite direction as predicted, a short position is recommended below 146.00 with the target at 146.25.
Chart Explanation: the black line shows the pivot point. The price above pivot point indicates the bullish position and when it is below pivot points, it indicates a short position. The red lines show the support levels and the green line indicates the resistance levels. These levels can be used to enter and exit trades.
Strategy: BUY, Stop Loss: 146.00, Take Profit: 147.30.
Resistance levels: 147.90, 147.50, and 148.00
Support levels: 146.25, 144.90, and 144.00


