Main Quotes Calendar Forum
flag

FX.co ★ Ichimoku indicator analysis of gold for July 7, 2017

parent
Forex Analysis:::2017-07-07T06:53:57

Ichimoku indicator analysis of gold for July 7, 2017

Gold price is consolidating above $1,210 and below $1,230. Price did not make a new overnight low as Silver did, while at the same time we observe bullish divergence signals by the oscillators.

Ichimoku indicator analysis of gold for July 7, 2017

Blue lines - bearish channel

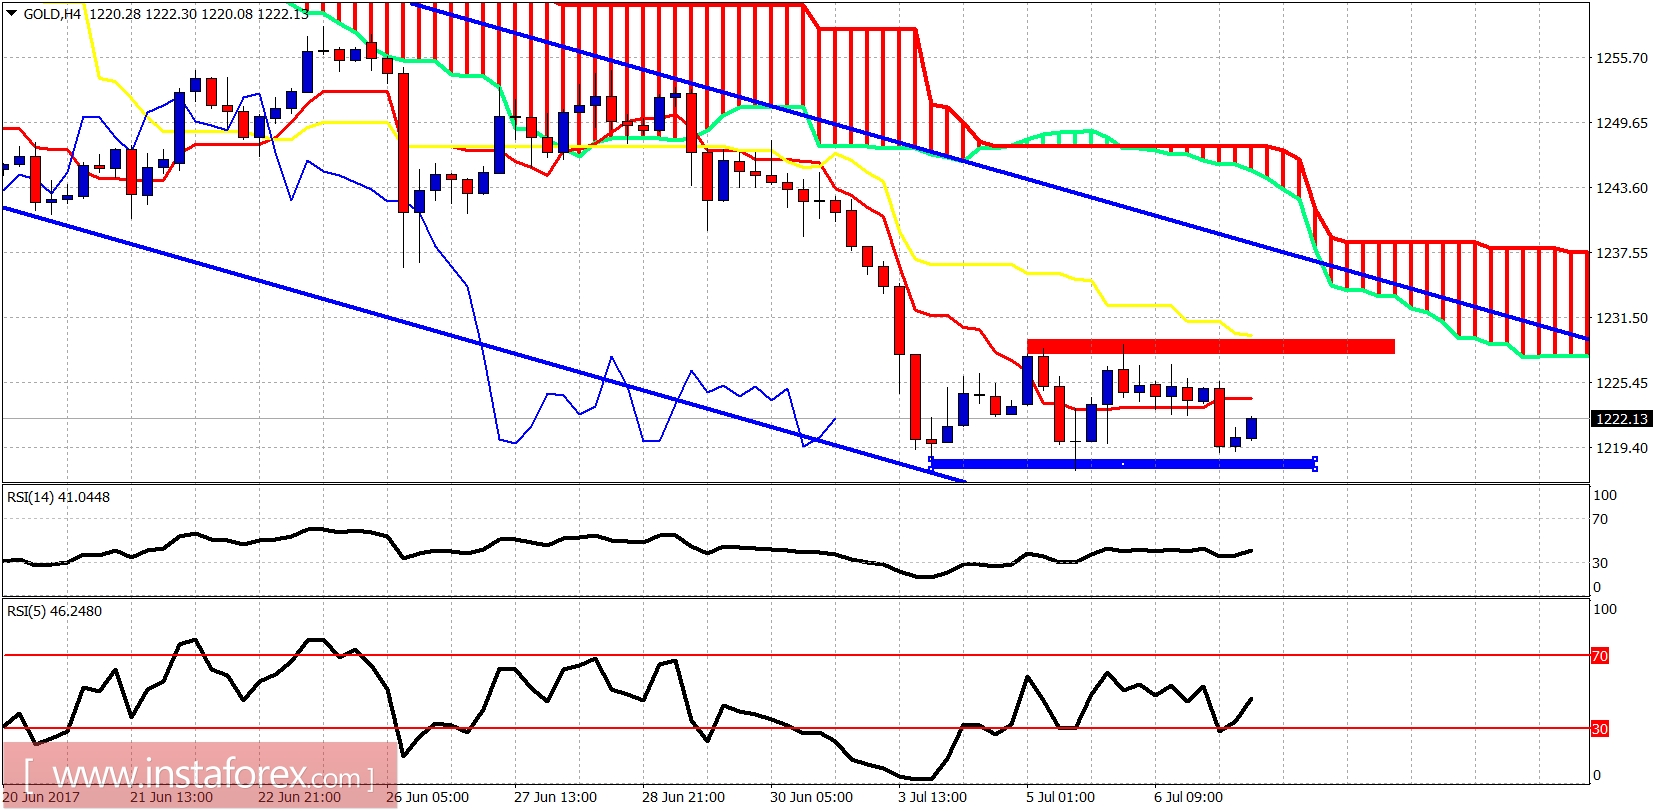
Red rectangle - resistance

Blue rectangle - support

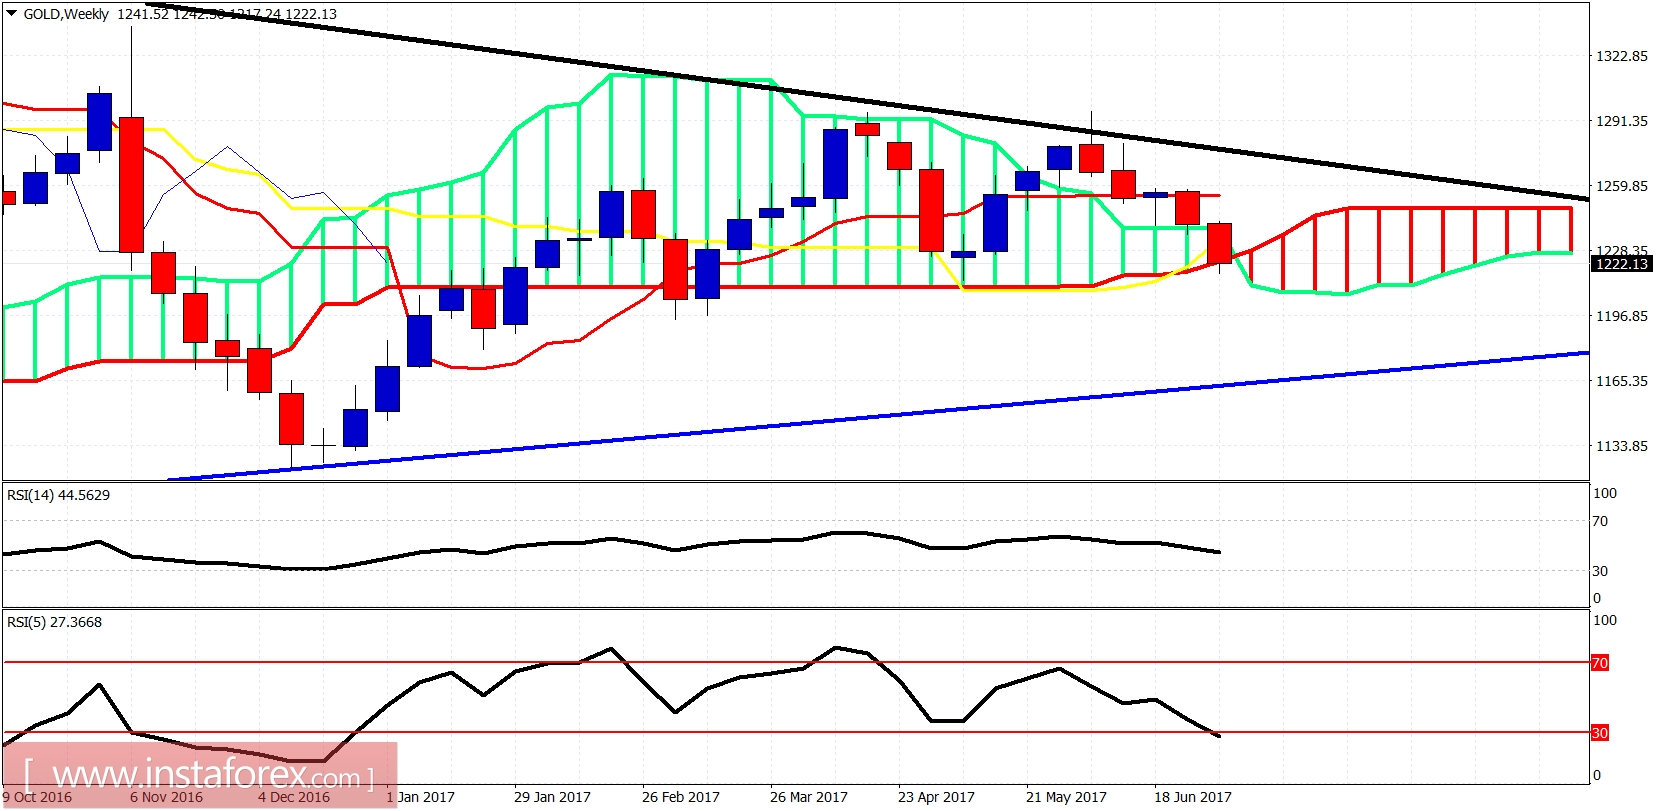
Short-term support is at $1,217. Resistance at $1,230. I believe we have more chances of breaking resistance and moving back towards $1,250-60. There we will see if we get another downward leg below $1,200 or break $1,300.

Ichimoku indicator analysis of gold for July 7, 2017

On a weekly basis price is testing the weekly Kumo (cloud). Breaking below the cloud will push price towards $1,180-60. Trend is neutral as price remains trapped between the black and blue trend lines. I remain longer-term bullish expecting Gold to eventually break $1,300 towards $1,400-$1,500. The $1,170-$1,200 price range is a gift for Gold bulls if we see it.
Analyst InstaForex
Share this article:
parent
loader...
all-was_read__icon
You have watched all the best publications
presently.
We are already looking for something interesting for you...
all-was_read__star
Recently published:
loader...
More recent publications...