


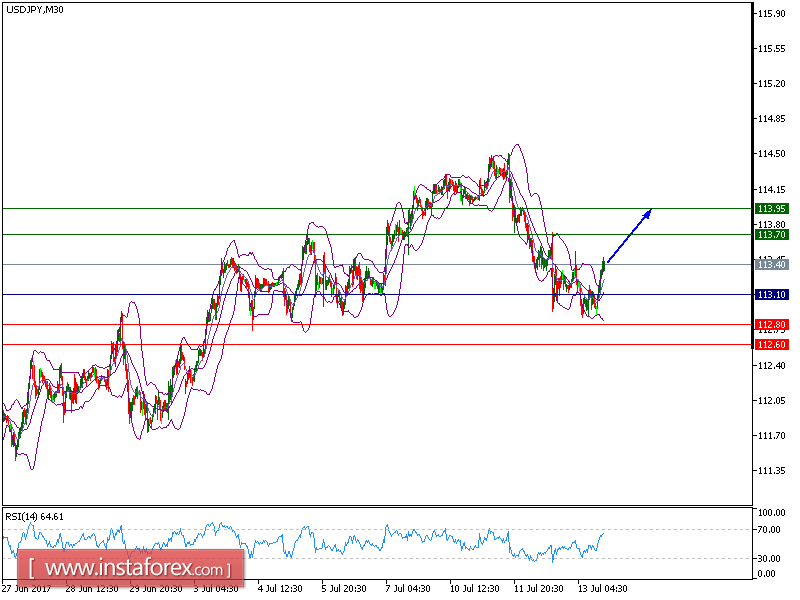
Our targets which we determined in yesterday's analysis have been hit. The pair is trading above its declining 50-period moving average, which is playing a support role. The RSI is above its neutrality level at 50. In addition, 113.10 is playing a key support role, which should limit the downside potential.
Alternatively, if the price moves in the opposite direction than predicted, a downside position is recommended above 113.10 with a target at 112.80.
Chart Explanation: The black line shows the pivot point. The current price above the pivot point indicates a bullish position while the price below the pivot point is a sign for a short position. The red lines show the support levels and the green line indicates the resistance level. These levels can be used to enter and exit trades.
Strategy : BUY , Stop Loss: 114, Take Profit: 114.90
Resistance levels: 113.70, 113.95, and 114.20
Support levels: 112.80,112.60, and 112.40


