


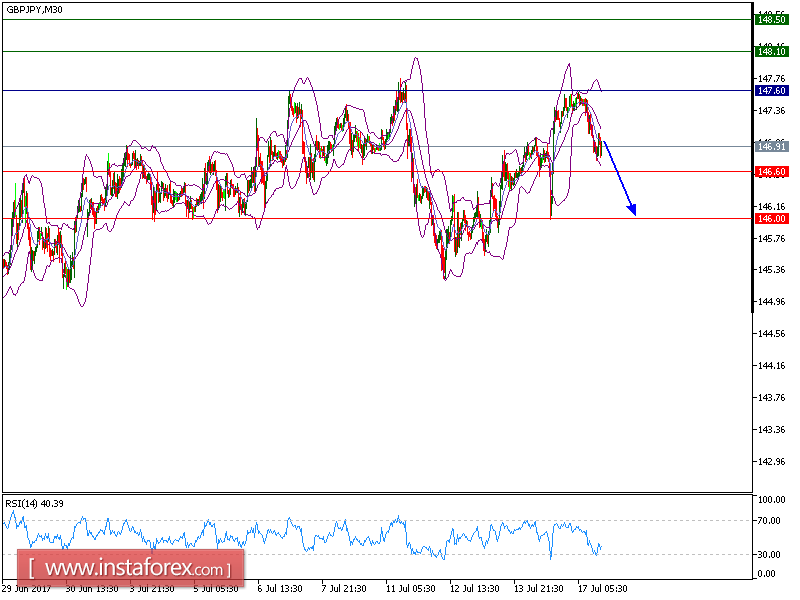
GBP/JPY is expected to trade with a bearish outlook. The pair broke above its 20-period moving average but is still capped by the 50-period one. The relative strength index is below its neutrality level at 50 and lacks upward momentum. In addition, 147.60 is playing a key resistance role, which should limit the upside potential.
As long as 147.60 holds on the upside, the pair is likely to return to its next support at 146.60. A break below this level would call for a further decline towards 146.00.
Alternatively, if the price moves in the opposite direction as predicted, a long position is recommended above 147.60 with the target at 148.10.
Chart Explanation: the black line shows the pivot point. The price above pivot point indicates the bullish position and when it is below pivot points, it indicates a short position. The red lines show the support levels and the green line indicates the resistance levels. These levels can be used to enter and exit trades.
Strategy: SELL, Stop Loss: 147.60, Take Profit: 14.60.
Resistance levels: 148.10, 148.50, and 149.05
Support levels: 146.60, 146.00, and 145.50


