


Overview:
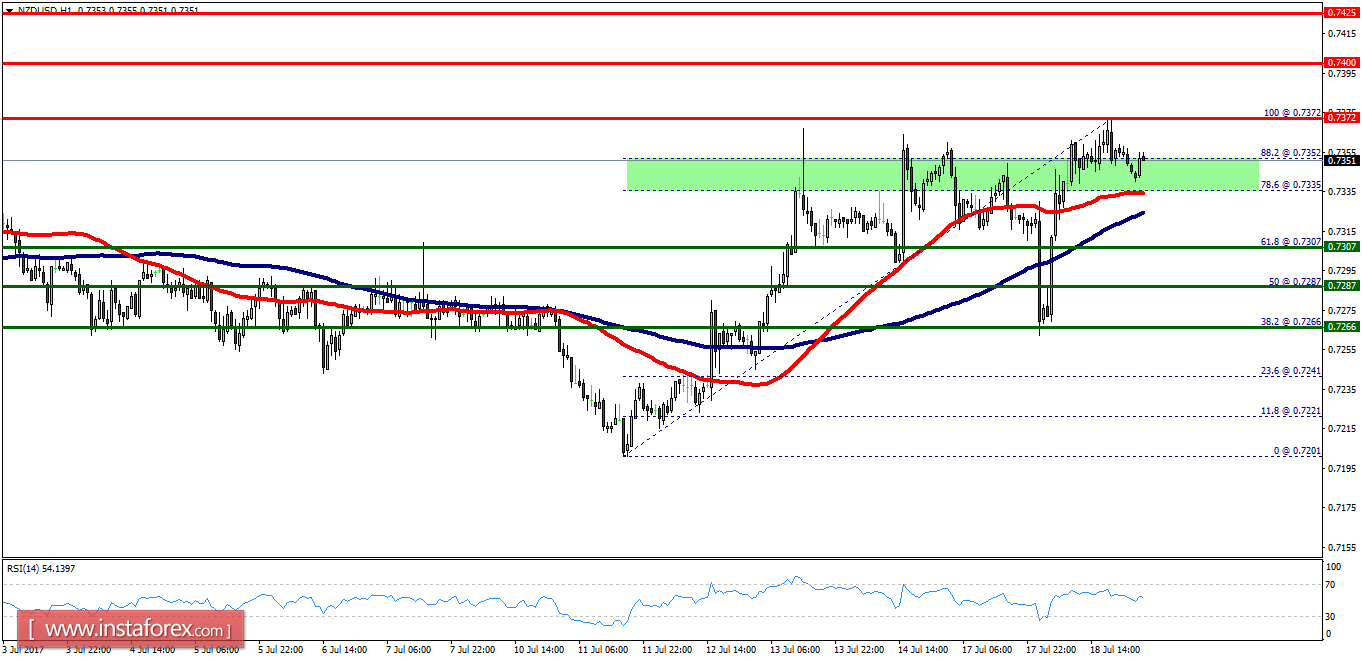
- The NZD/USD pair is showing signs of strength following a breakout of the highest level of 0.7307. On the H1 chart. the level of 0.7307 coincides with 61.8% of Fibonacci, which is expected to act as minor support today. Since the trend is above the 61.8% Fibonacci level, the market is still in an uptrend. So, major support is seen at the level of 0.7307. Furthermore, the trend is still showing strength above the moving average (100). Thus, the market is indicating a bullish opportunity above the above-mentioned support levels, for that the bullish outlook remains the same as long as the 100 EMA is headed to the upside. Therefore, strong support will be found at the level of 0.7307 providing a clear signal to buy with a target seen at 0.7372. If the trend breaks the minor resistance at 0.7372, the pair will move upwards continuing the bullish trend development to the level 0.7400 in order to test the daily resistance 1. However, it would also be sage to consider where to place a stop loss; this should be set below the second support of 0.7287.


