


The pair is moving in sideways around the 200 SMA zone at H1 chart and still, the bullish structure doesn't have enough strength. We need to see a break above the resistance level of 1.3037 in order to test the 1.3106 level. However, GBP/USD is struggling to hold above 1.2968 and if that zone gives up, a decline could be seen towards 1.2882.
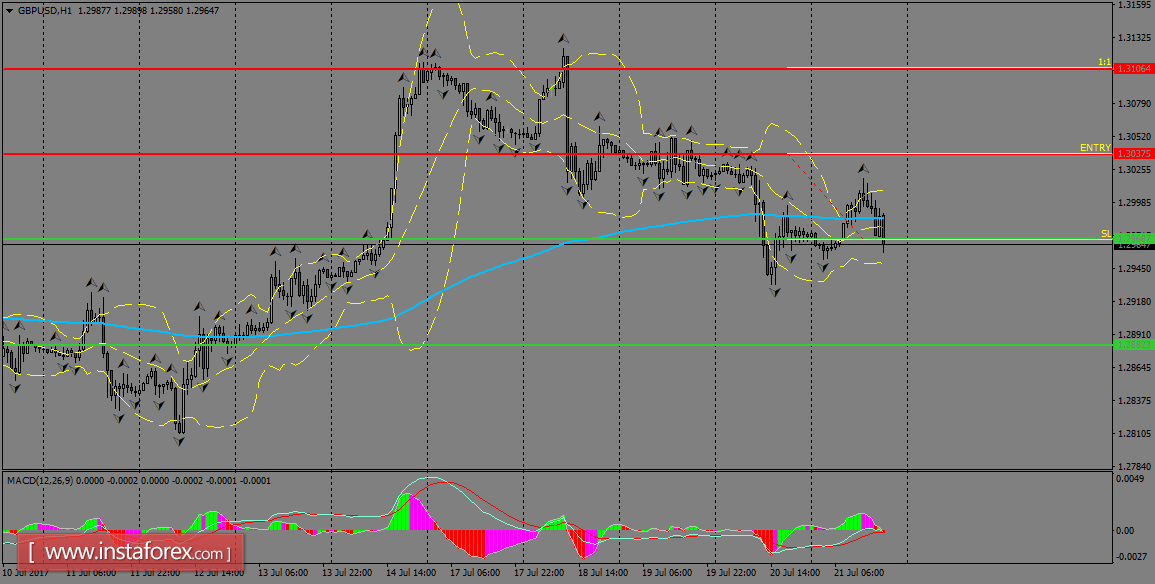
H1 chart's resistance levels: 1.3037 / 1.3106
H1 chart's support levels: 1.2968 / 1.2882
Trading recommendations for today: Based on the H1 chart, buy (long) orders only if the GBP/USD pair breaks a bullish candlestick; the resistance level is at 1.3037, take profit is at 1.3106 and stop loss is at 1.2968.


