


USDX is currently forming a bottom around the psychological zone of 94.00 and we can expect some corrective moves to take place, towards the 200 SMA at H1 chart. If a dynamic resistance is found around that area, the index could resume the bearish path towards the 93.29 level. MACD indicator is supporting the recovery scenario.
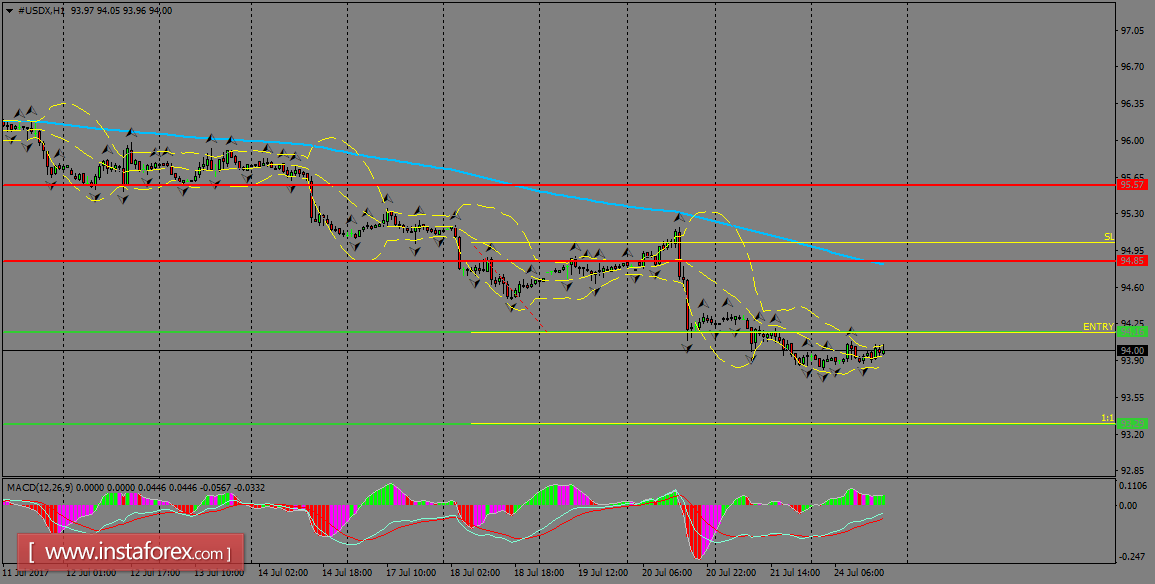
H1 chart's resistance levels: 94.85 / 95.57
H1 chart's support levels: 94.16 / 93.29
Trading recommendations for today: Based on the H1 chart, place sell (short) orders only if the USD Index breaks with a bearish candlestick; the support level is at 94.16, take profit is at 93.29 and stop loss is at 95.02.


