Main Quotes Calendar Forum
flag

FX.co ★ Technical analysis of gold for July 26, 2017

parent
Forex Analysis:::2017-07-26T07:31:12

Technical analysis of gold for July 26, 2017

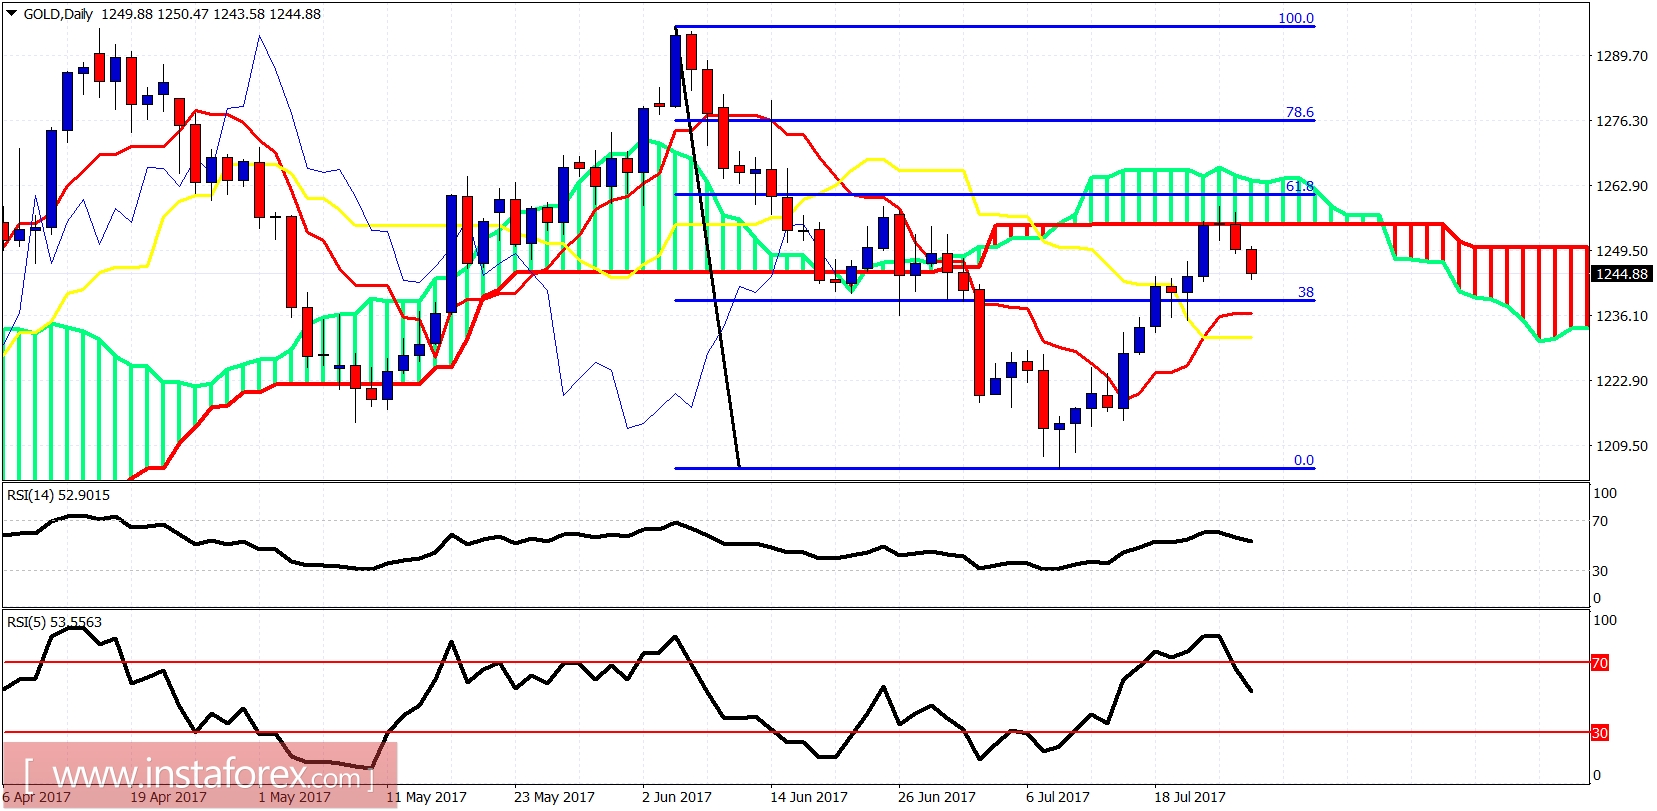
The Gold price got rejected just below the $1,260 level yesterday and has pulled back towards $1,245. Support is critical now at $1,243-$1,237 and if this level is broken we should expect a move at least towards $1,227.

Technical analysis of gold for July 26, 2017

Red rectangle - support area

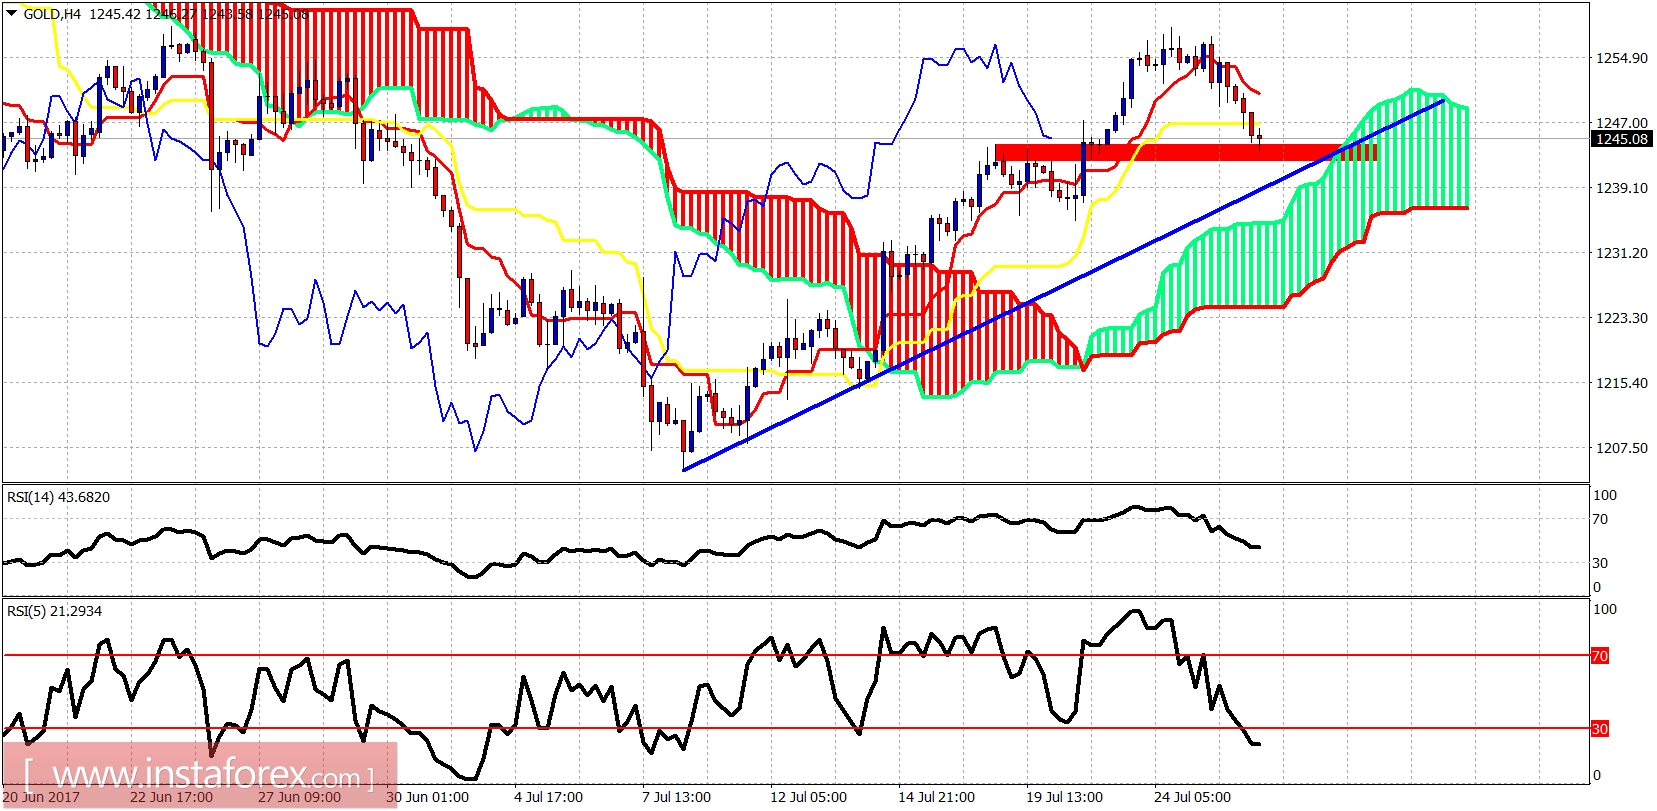
Blue trend line - support

The Gold price remains in a bullish trend as price is above the Kumo (cloud). Price is pulling back to back test the breakout area of $1,243-40. Holding above the red rectangle and the blue trend line will be a bullish sign and might bring in more buyers for another leg higher towards $1,275-80.

Technical analysis of gold for July 26, 2017

The Gold price got rejected at the Daily Kumo and near the 61.8% Fibonacci retracement of the decline. The daily trend remains bearish as long as the price is below the Kumo. Daily support is at $1,237-31. Resistance is at $1,257 and next at $1,265.
Analyst InstaForex
Share this article:
parent
loader...
all-was_read__icon
You have watched all the best publications
presently.
We are already looking for something interesting for you...
all-was_read__star
Recently published:
loader...
More recent publications...