


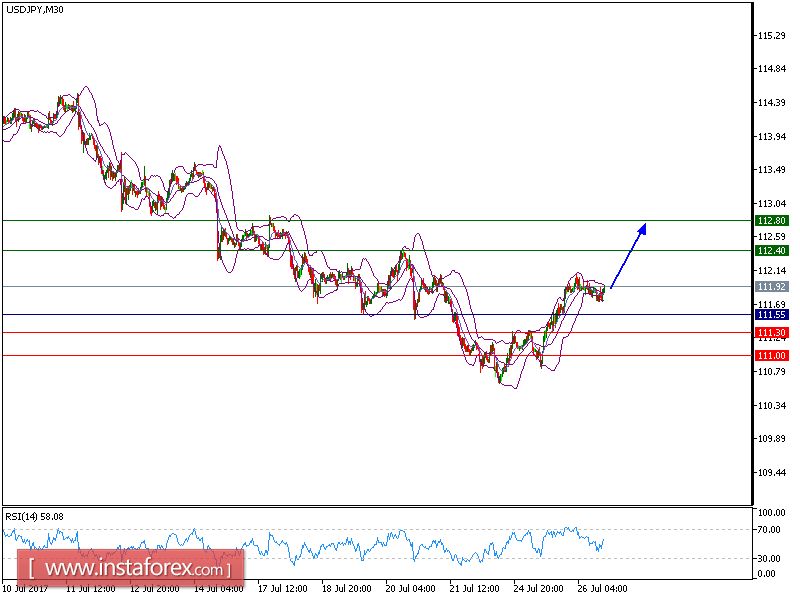
Our upward targets which we predicted in yesterday's analysis have been hit. USD/JPY is expected to advance further. The pair is trading above its rising 20-period and 50-period moving averages, which play support roles and maintain the upside bias. The relative strength index shows upward momentum.
Hence, as long as 111.55 is support, look for a new rise to 112.40 and even to 112.80 in extension.
Alternatively, if the price moves in the opposite direction, a short position is recommended below 111.55 with a target at 111.30.
Chart Explanation: The black line shows the pivot point. The current price above the pivot point indicates a bullish position while the price below the pivot point is a signal for a short position. The red lines show the support levels and the green line indicates the resistance level. These levels can be used to enter and exit trades.
Strategy: BUY, Stop Loss: 111.55, Take Profit: 112.40
Resistance levels: 112.40, 112.80, and 113.15 Support Levels: 111.30, 111.00, 110.50


