Main Quotes Calendar Forum
flag

FX.co ★ Technical analysis of gold for July 28, 2017

parent
Forex Analysis:::2017-07-28T07:29:18

Technical analysis of gold for July 28, 2017

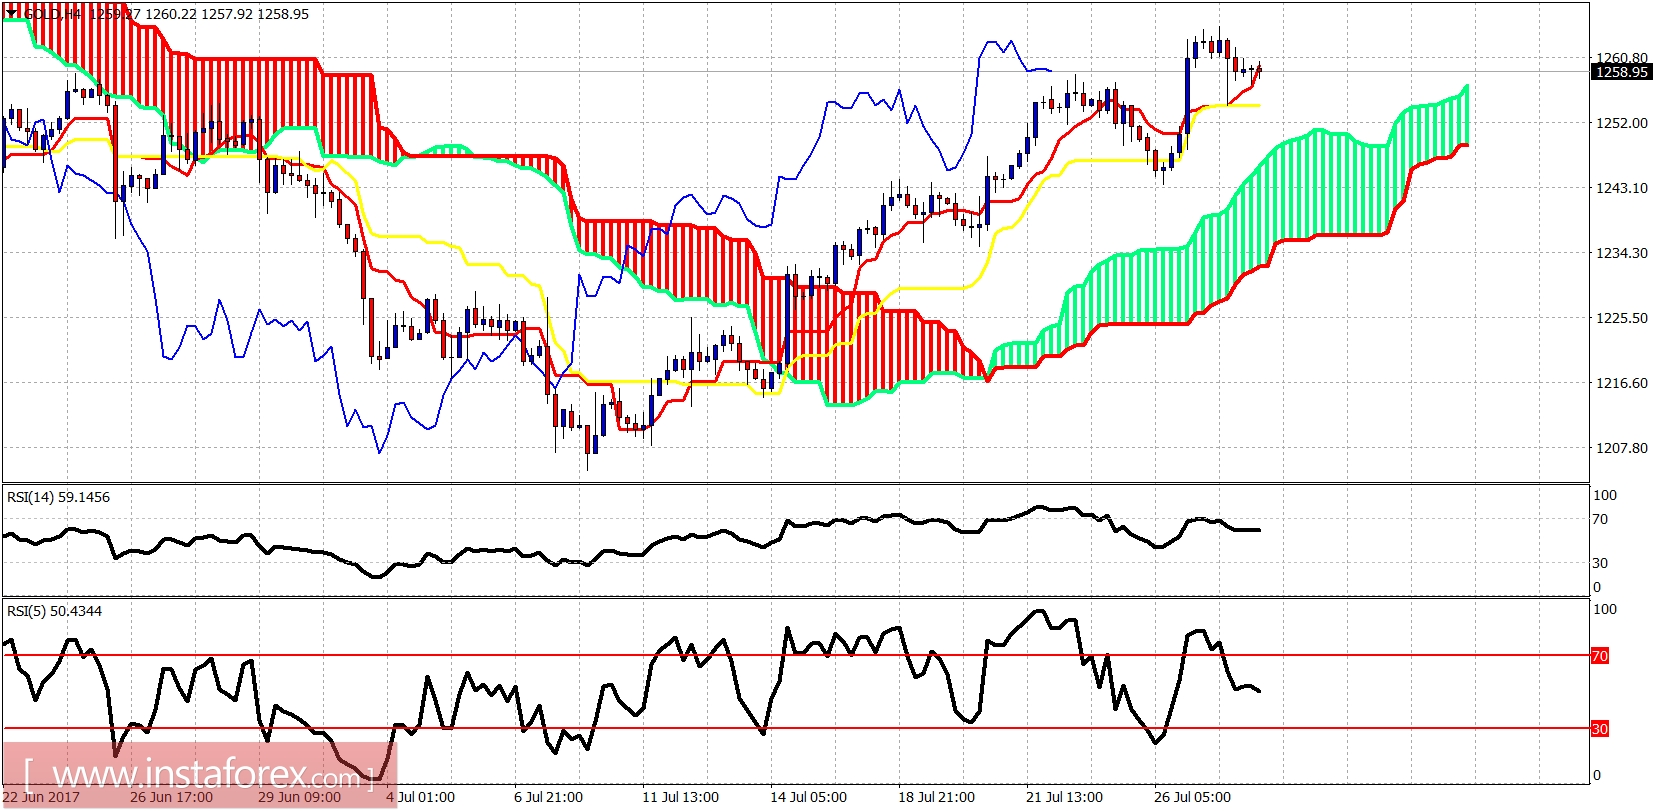
The Gold price made a new higher high yesterday and remains in a bullish trend. The Gold price is breaking above the $1,250-60 resistance area and is heading towards the long-term resistance at $1,280-90.

Technical analysis of gold for July 28, 2017

The Gold price is trading above both the tenkan- and kijun-sen. There are initial signs of a bearish divergence but the price continues to make higher highs and higher lows. Support is at $1,245. Resistance is at $1,275.

Technical analysis of gold for July 28, 2017

Blue line - long-term support

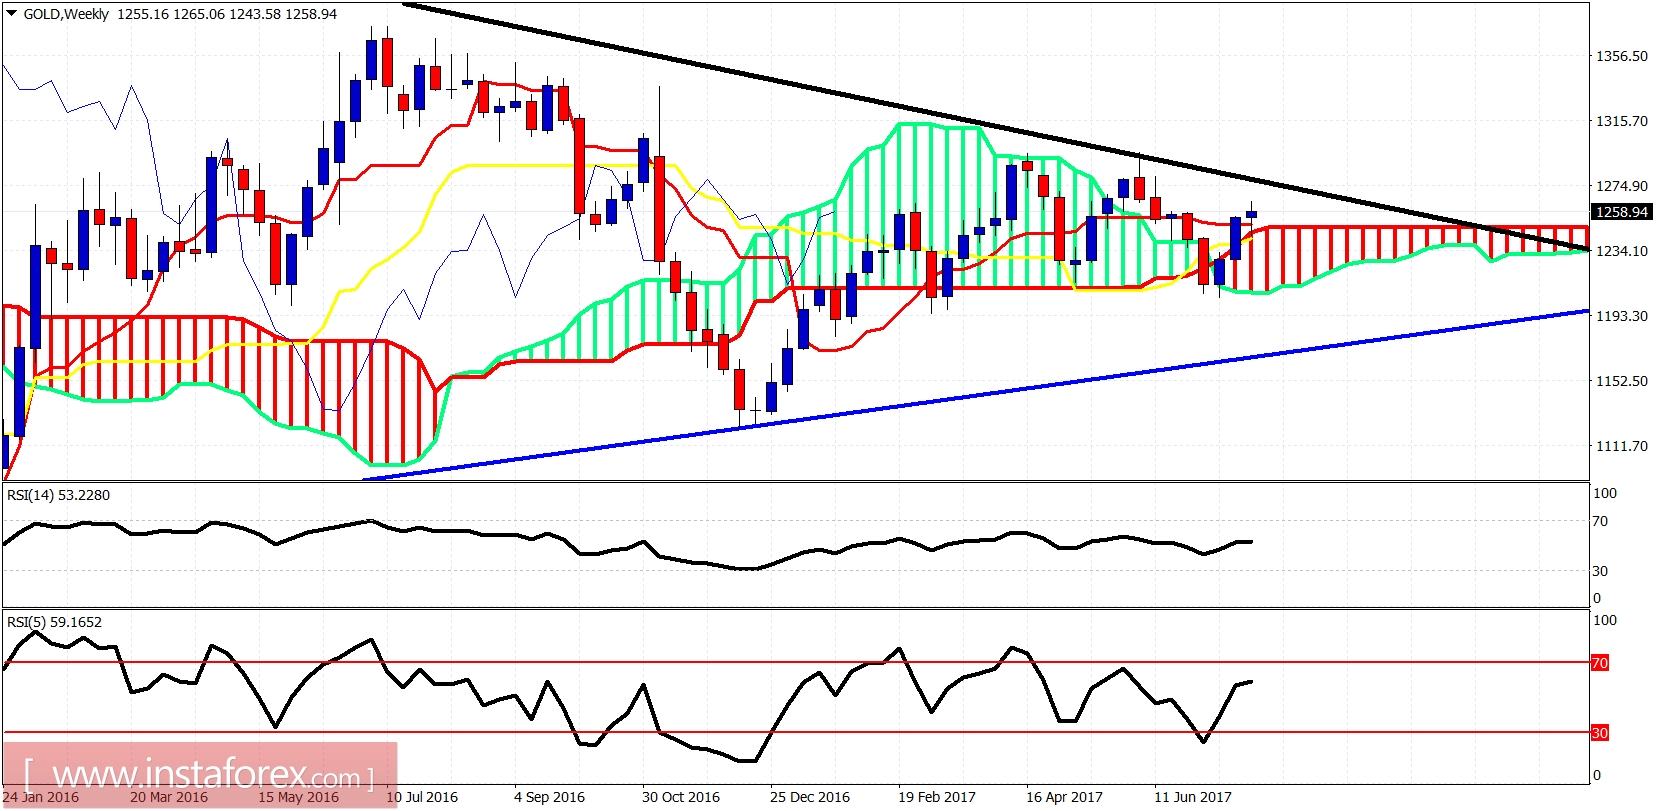
Black line - long-term resistance

Long-term resistance trend line from the ATH is at $1,275-80. The Gold price has not managed to break it every time it tried since November 2015 when medium-term trend changed. A rejection at $1,275 will push the price back towards the weekly Kumo at $1,250-40. If a cloud is broken we should expect the Gold price to test the blue trend line. I remain long-term bullish.

Analyst InstaForex
Share this article:
parent
loader...
all-was_read__icon
You have watched all the best publications
presently.
We are already looking for something interesting for you...
all-was_read__star
Recently published:
loader...
More recent publications...