


The Gold price continues to make higher highs and higher lows above our minimum target of $1,260. The trend remains bullish. A reversal from current levels is justified. Even a pull back towards $1,240.
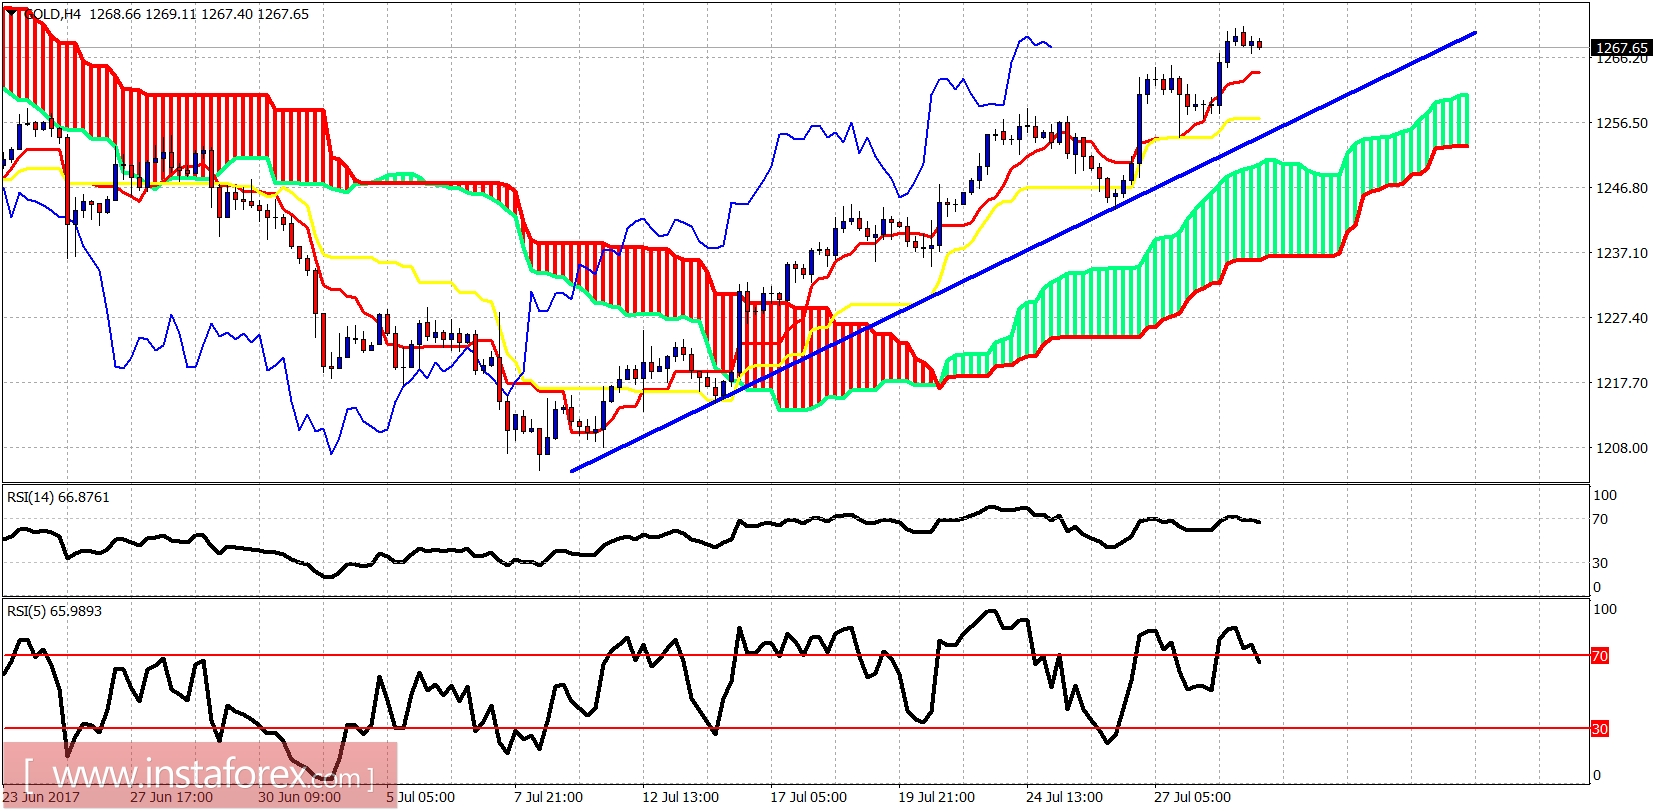
The Gold price is trading above both the tenkan- and kijun-sen indicators. Short-term support by the trend line and the kijun-sen is at $1,257. Resistance is at $1,275-80 next. There is no bearish divergence on the 4-hour chart by the oscillators.
Blue line- long-term support trend line
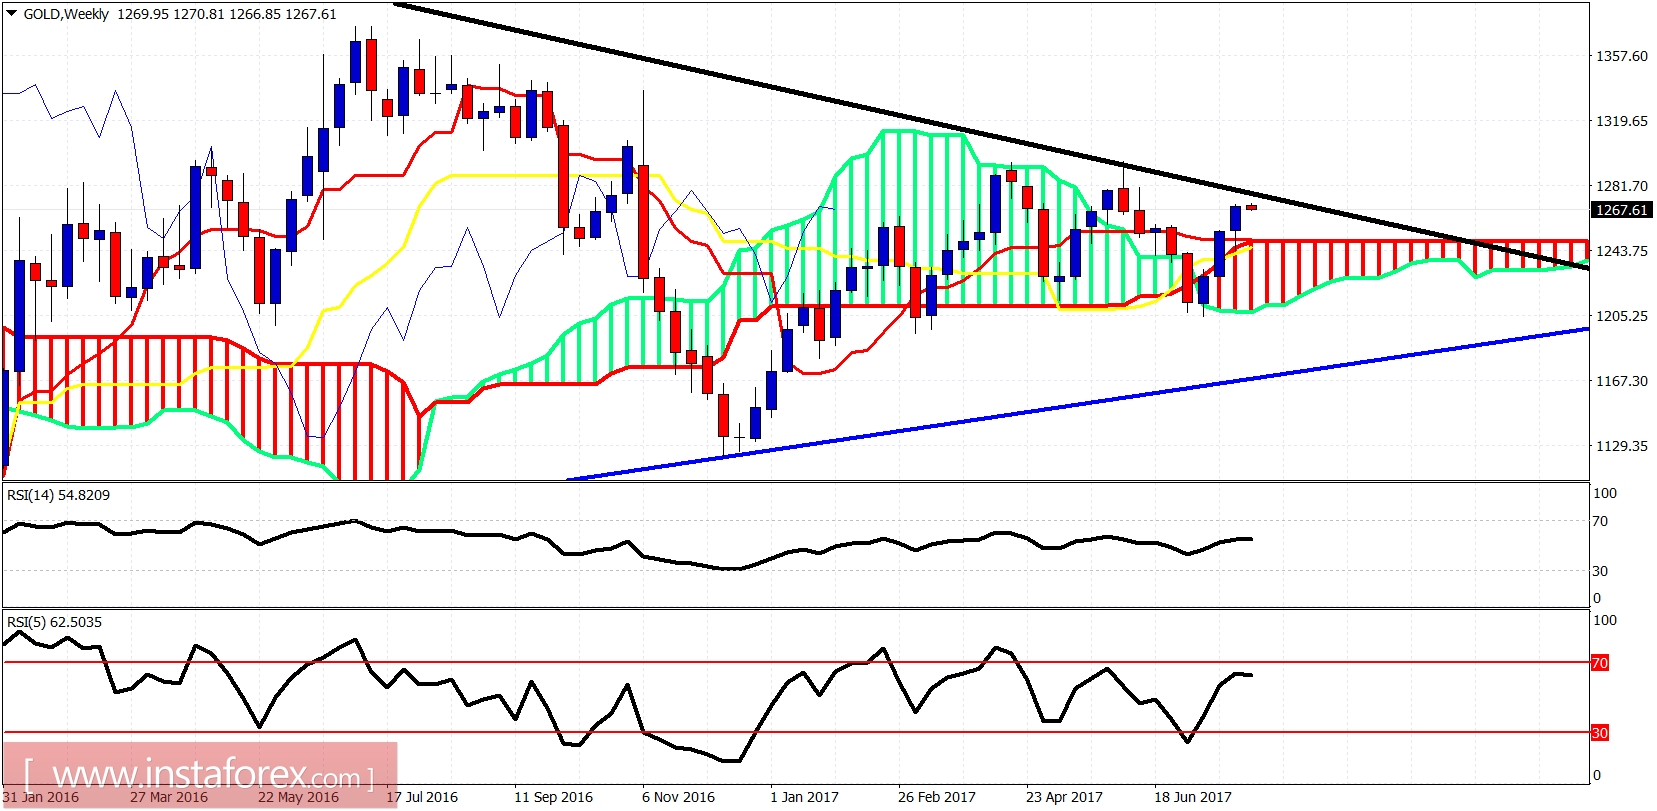
The weekly chart is still trapped inside the triangle formation. Price remains below the black trend line coming from its all time highs. Price is above the weekly Kumo and this is a bullish sign. However, bulls will need to break above the black trend line resistance otherwise they are in danger of another rejection and a pull back towards the blue trend line support.


