


The greenback is weak ahead of the end of the month and the 200 SMA still provides the line in the sand in the index. The next target is placed at the 92.29 level, as the US Dollar Index is trying to consolidate below the support zone of 93.25. To the upside, the nearest resistance is provided by the 200 SMA at H1 chart and if the index manages to break it, then we can expect a continuation towards 94.57.
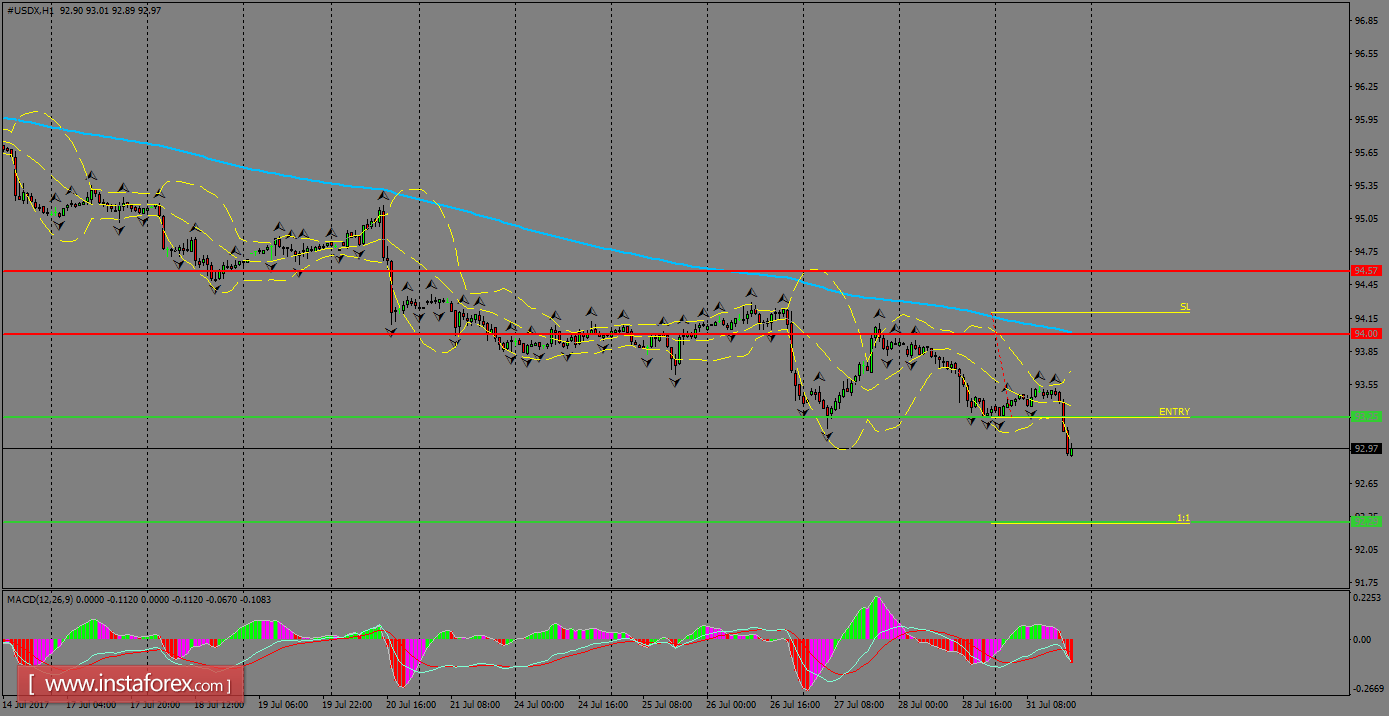
H1 chart's resistance levels: 94.00 / 94.57
H1 chart's support levels: 93.25 / 92.29
Trading recommendations for today: Based on the H1 chart, place sell (short) orders only if the USD Index breaks with a bearish candlestick; the support level is at 93.25, take profit is at 92.29 and stop loss is at 94.20.


