Main Quotes Calendar Forum
flag

FX.co ★ Technical analysis of gold for August 1, 2017

parent
Forex Analysis:::2017-08-01T07:24:57

Technical analysis of gold for August 1, 2017

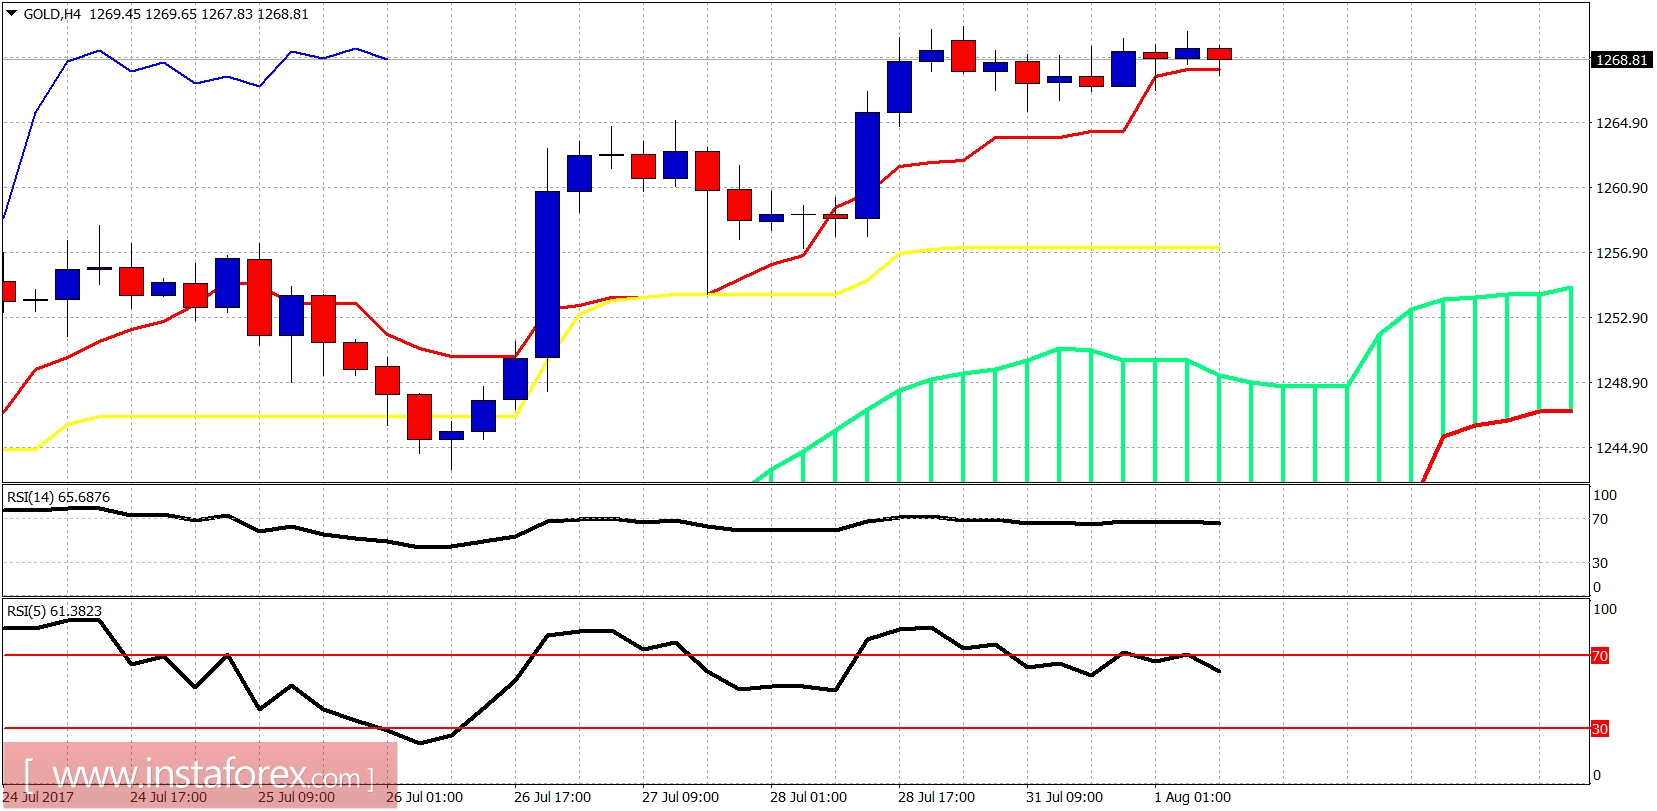
Gold price remains in a bullish trend. In the short-term price is moving sideways in a tight range between $1,271 and $1,265. There are more chances for an upward break out and an extended to move higher towards $1,295-$1,310.

Technical analysis of gold for August 1, 2017

Short-term support by the kijun-sen (yellow line indicator) is found at $1,257. Cloud support on the 4-hour chart is at $1,252. Only a break below the Kumo (cloud) support would be a signal for a short-term reversal and correction.

Technical analysis of gold for August 1, 2017

Black line -long-term resistance

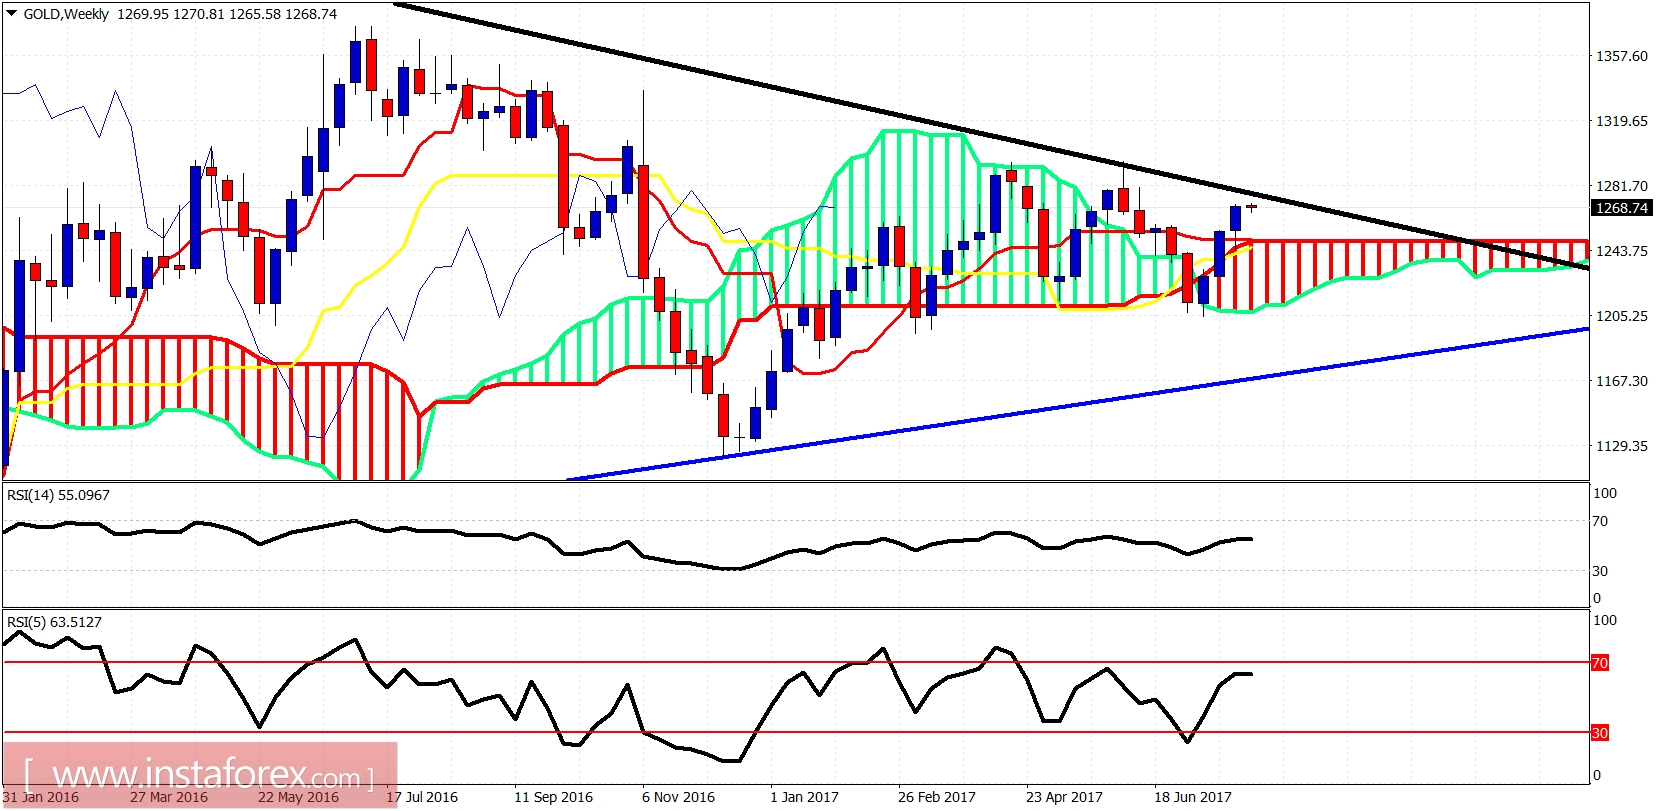
Blue line - long-term support

The weekly Gold candle is above the weekly Kumo (cloud) but still below the long-term black trend line resistance. I continue to expect that Gold price will eventually break above the black trend line and in the longer-term will move towards $1,500-$1,600.

Analyst InstaForex
Share this article:
parent
loader...
all-was_read__icon
You have watched all the best publications
presently.
We are already looking for something interesting for you...
all-was_read__star
Recently published:
loader...
More recent publications...