


The USD/CAD pair has paused its strong decline just above 1.24 and shows signs of a possible reversal. The minimum bounce target is at 1.27 but if we get a confirmed reversal soon, I expect see this bounce to extend even towards 1.2850-1.29.
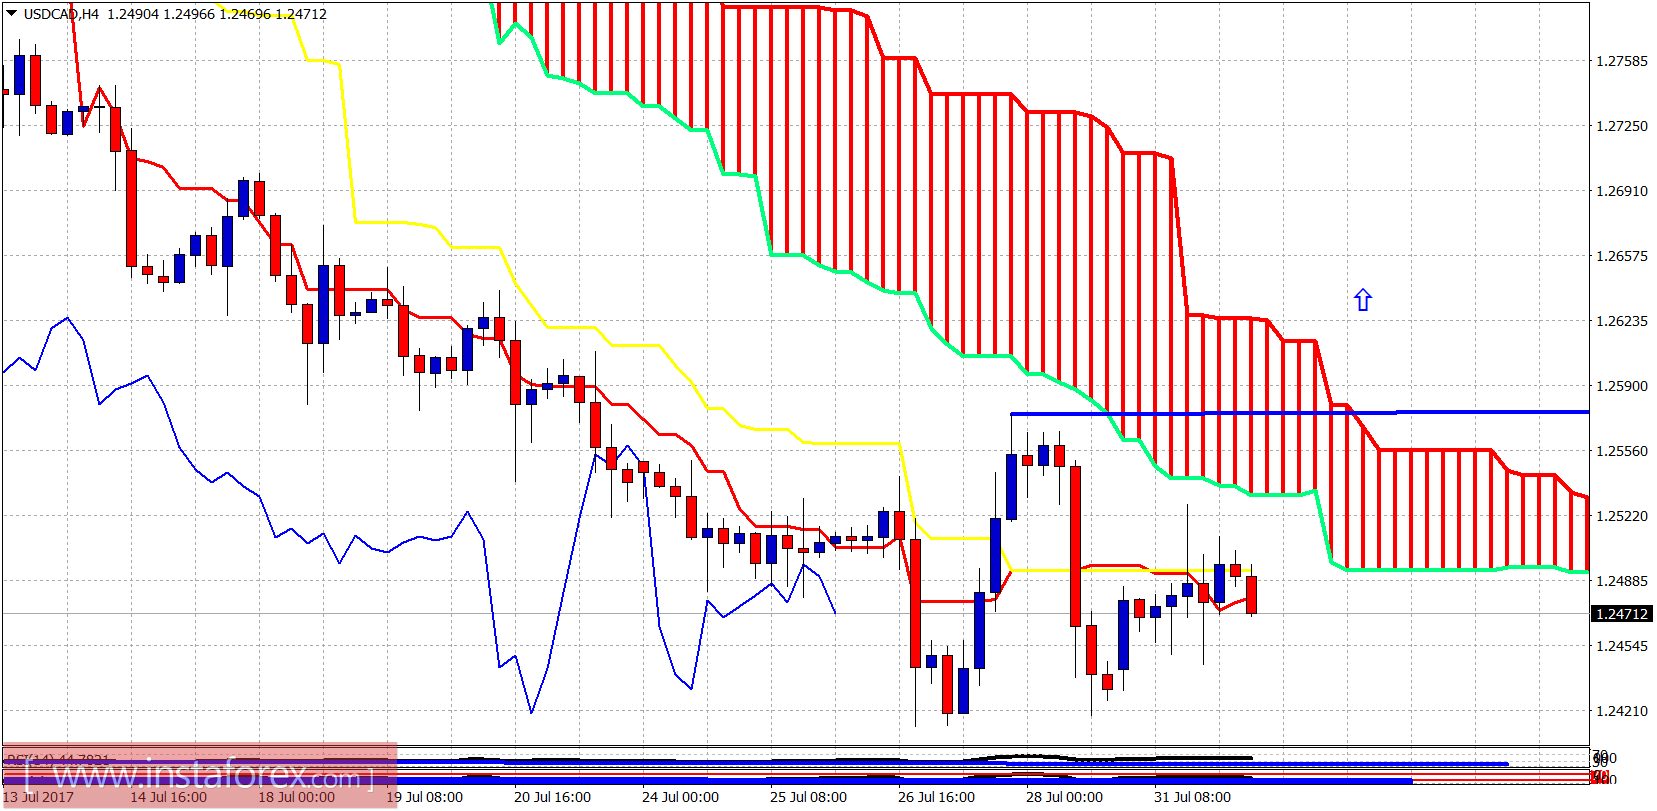
The short-term trend remains bearish as price is still below the 4 hour Kumo cloud. The short-term support lies at 1.24 while the resistance is found at 1.2575. The price has been moving sideways since 25th of July and bulls will need to break above the cloud and the recent high in order to confirm the change of trend .
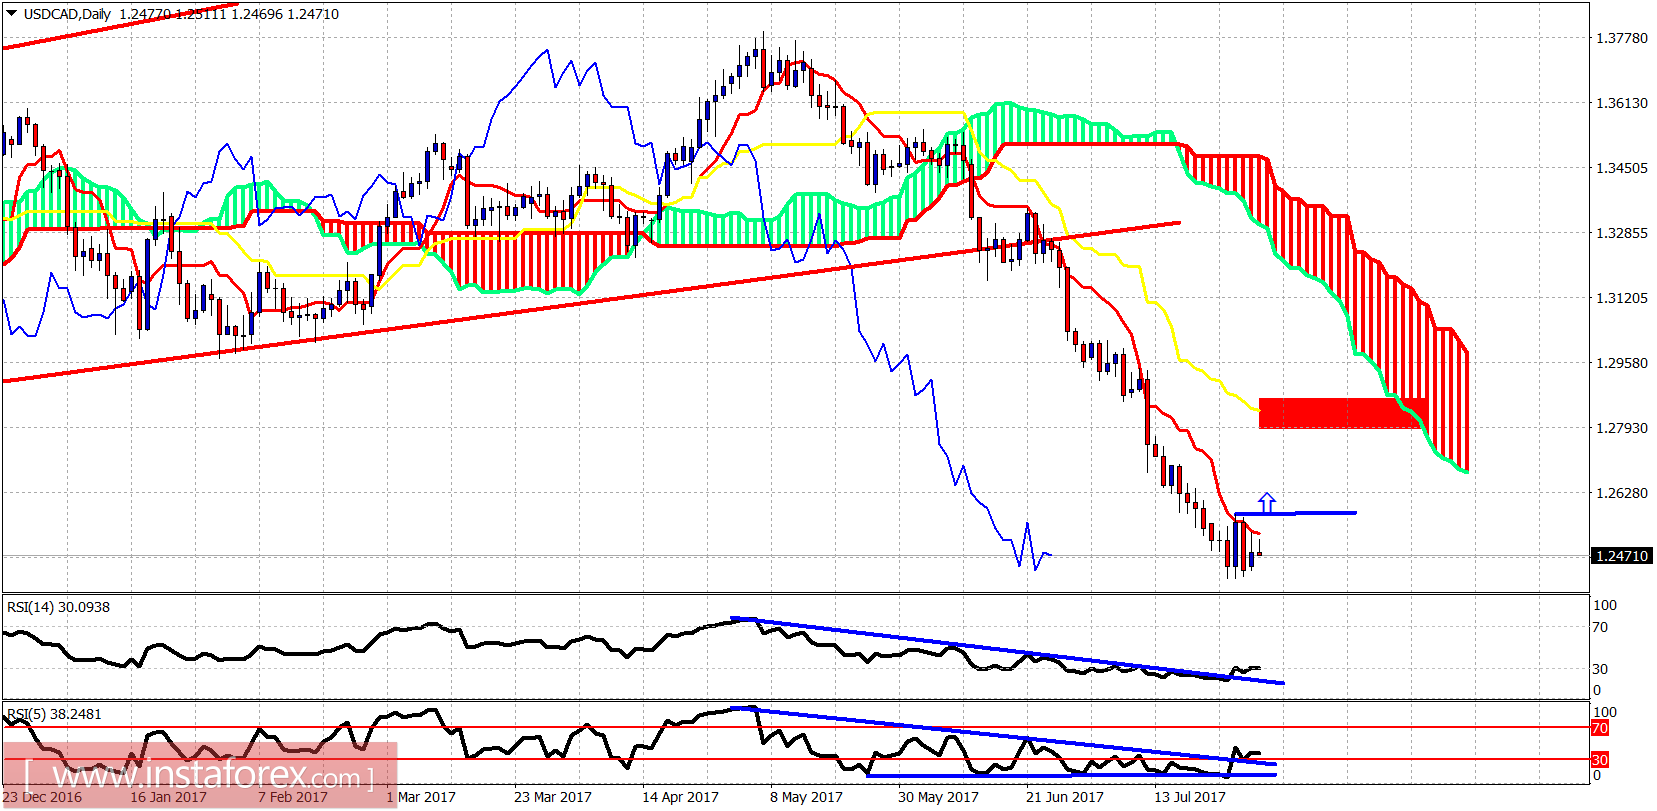
The daily oscillators are turning upwards from the oversold levels after showing bullish divergence signs. The trend remains bearish in the daily chart and only a daily close above the Tenkan-Sen (red line indicator) will be a bullish reversal confirmation. This price level is at 1.2530. Target for the reversal if it has already started lies at 1.28.


