


The USD/CAD is making higher highs and higher lows. The trend is now bullish in the short-term. We gave the bullish signal a couple days back when we said that there were signs of a bullish reversal targeting 1.28.
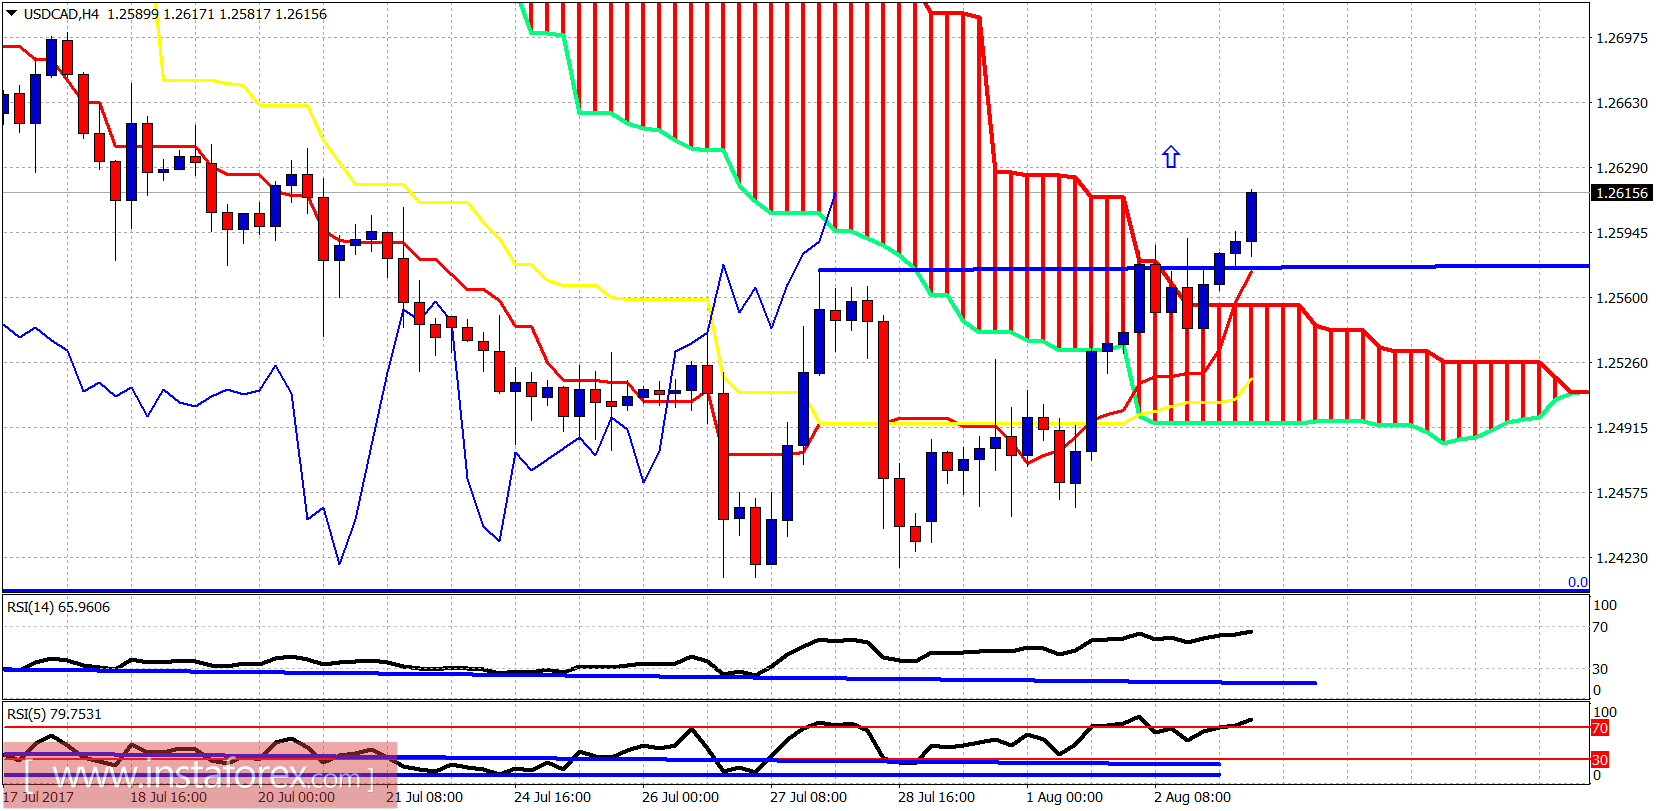
Yesterday we saw price break out of the 4 hour Kumo (cloud) and the horizontal resistance at 1.2575. This confirmed our bullish reversal view and we are now looking for a move towards 1.27-1.28. Short-term support is at 1.2560. Resistance is at 1.2620.
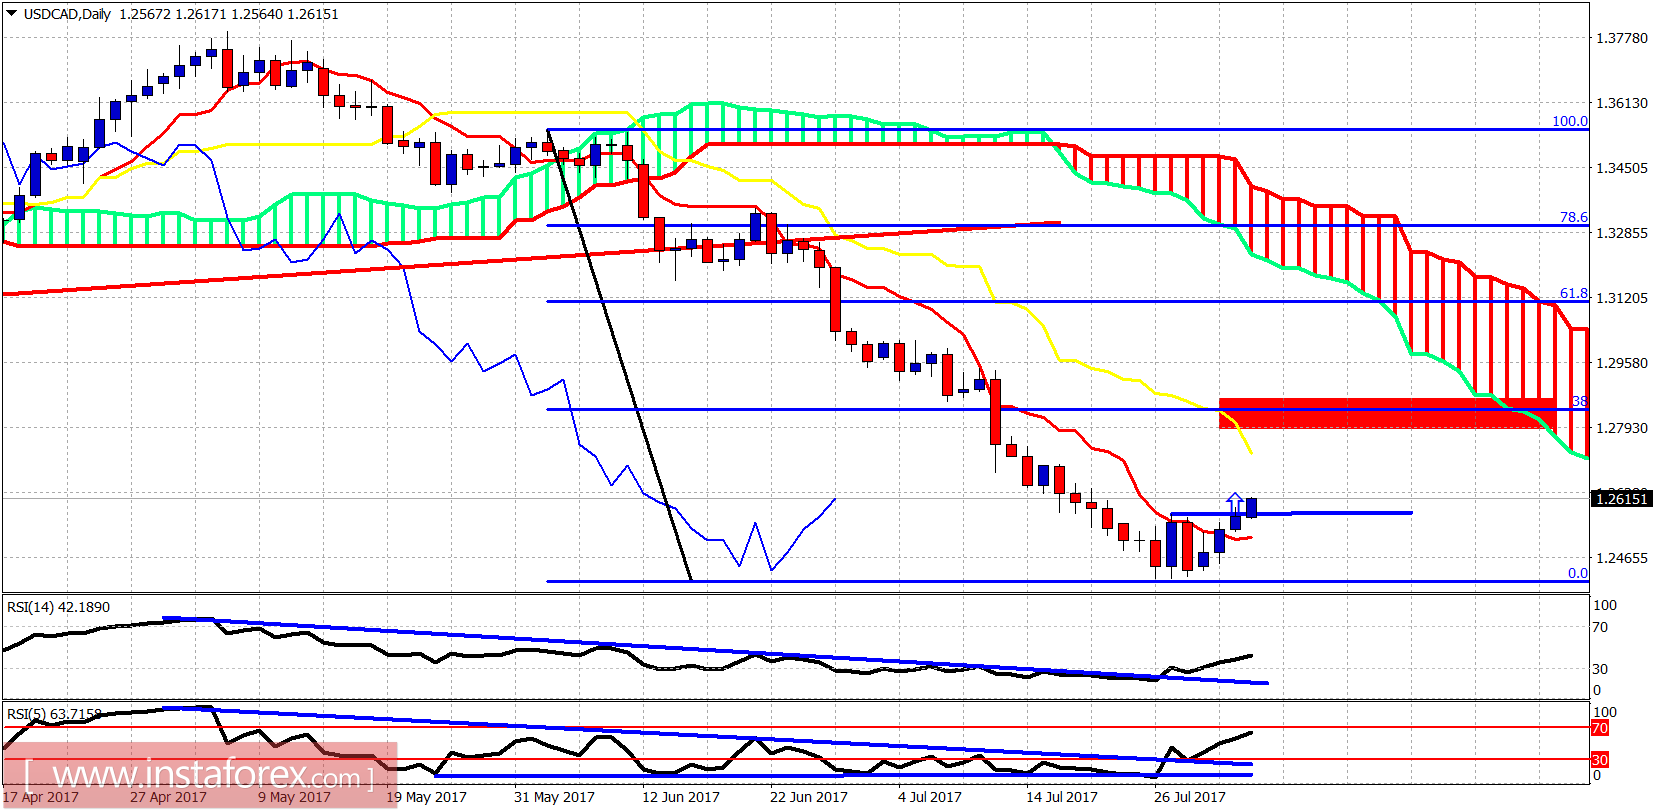
The Daily chart above shows our target at the 38% Fibonacci retracement of the decline. The RSI has broken out of the downward sloping wedge. The trend is bullish in the short-term. The RSI has not reached yet overbought levels. We have upside potential to 1.28.


