


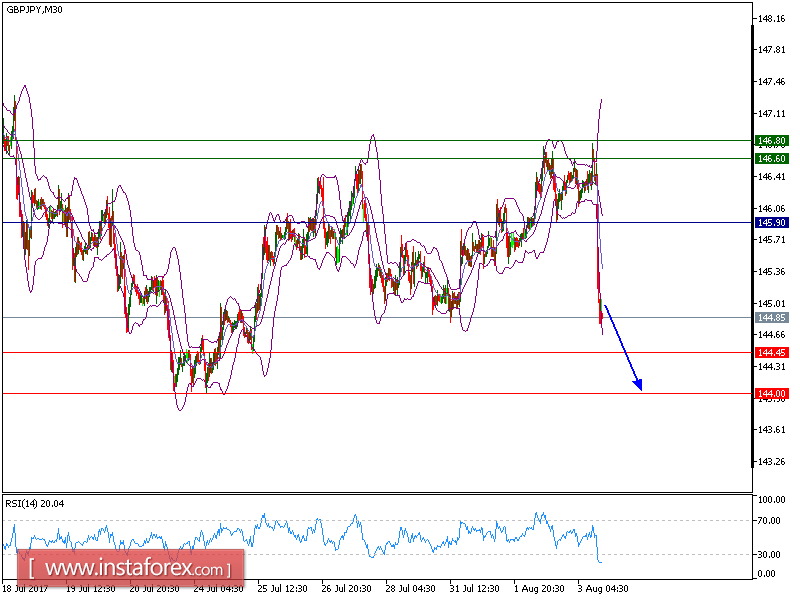
GBP/JPY is under pressure, pair retreated quickly and now trading at 144.85. The pair broke below its lower boundary of Bollinger Bands, which confirmed a continuation of a bearish trend. The 20-period moving average is turning down. The relative strength index is heading downward.
Therefore, as long as 145.90 is not surpassed, look for a further drop to 144.45 and even to 144.00 in extension.
Alternatively, if the price moves in the opposite direction as predicted, a long position is recommended above 145.90 with the target at 146.60.
Strategy: SELL, Stop Loss: 145.90, Take Profit: 146.60.
Chart Explanation: the black line shows the pivot point. The price above the pivot point indicates the bullish position and when it is below the pivot points, it indicates a short position. The red lines show the support levels and the green line indicates the resistance levels. These levels can be used to enter and exit trades.
Resistance levels: 146.60, 146.80, and 147.35
Support levels: 144.45, 144.00, and 143.45.


