


Overview:
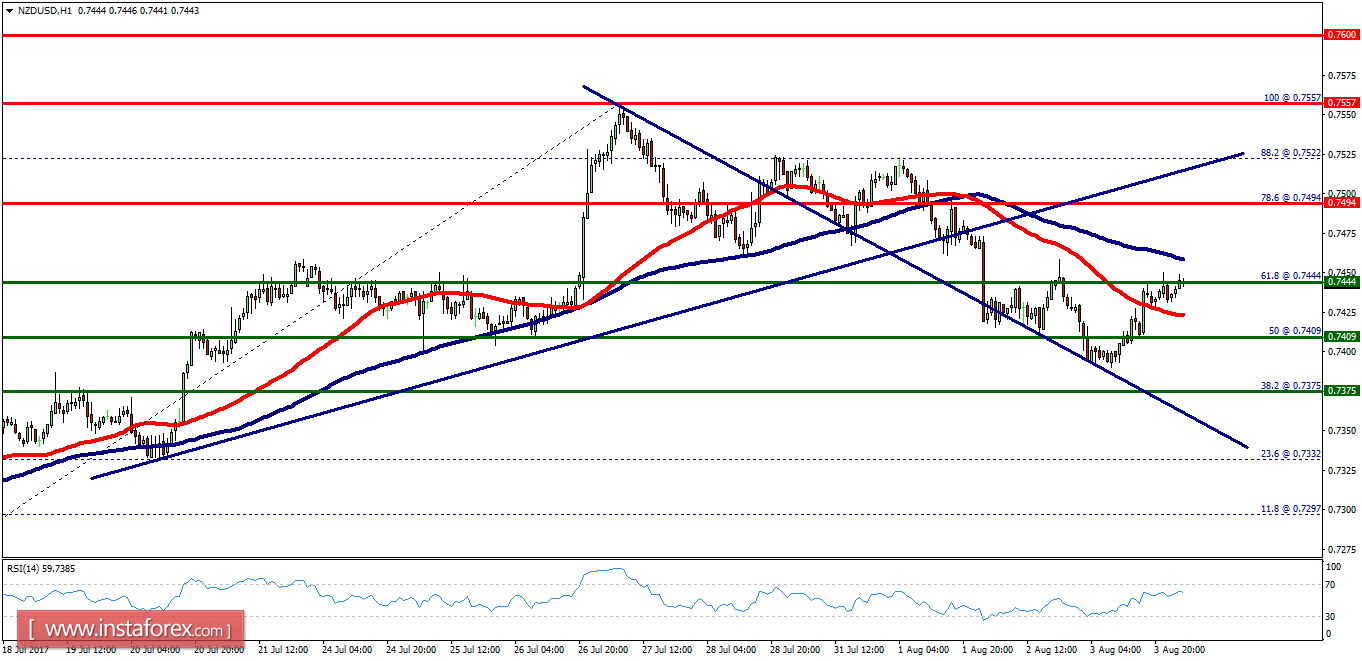
- The NZD/USD pair will probably continue to move upwards from the level of 0.7409 (50% of Fibonacci retracement levels). Since the trend is above the 50% Fibonacci level, the market is still in an uptrend on the H1 chart. Also, it should be noted that, сurrently, the pair is moving around the spot of 0.7409. However, the first resistance level is seen at 0.7494 and 0.7557 followed by 0.7600, while the daily support 1 is seen at 0.7444 (61.8% Fibonacci retracement). According to the previous events, the NZD/USD pair is still moving between the levels of 0.7409 and 0.7600. Furthermore, if the trend is able to break out the first resistance level at 0.7494, we could see the pair climbing towards the double top (0.7600) to test it. Therefore, buy above the level of 0.7490 with the first target at 0.7494 in order to test the daily resistance 1 and further to 0.7557 (the double top). On the other hand, in case a reversal takes place and the NZD/USD pair breaks through the support level of 0.7375. Hence, the stop loss should be taken into account, for that it will be reasonable to set your stop loss at the level of 0.7350 or 0.7330.


