


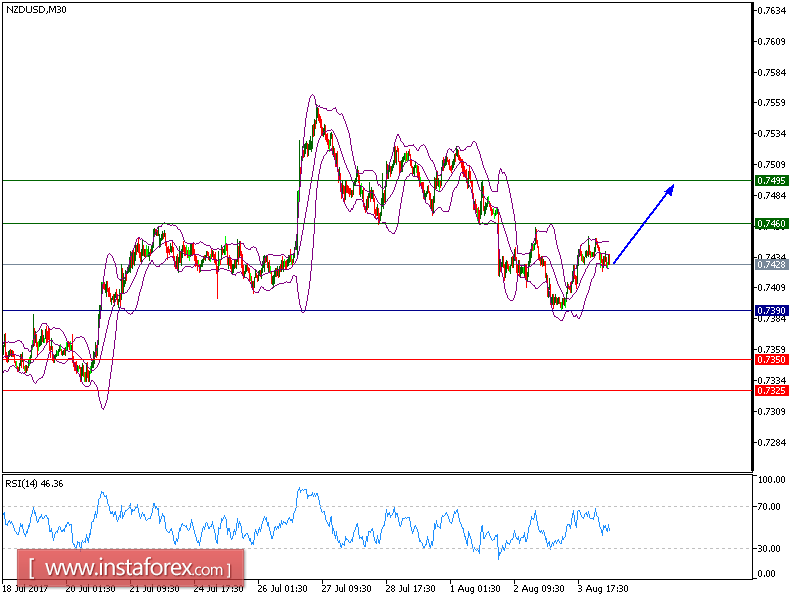
NZD/USD is expected to trade with bullish bias and maintain the outlook for further rise. The pair is trading above its rising 20-period moving average, which plays a support role. The relative strength index is above its neutrality level at 50 and calls for a new upside.
Hence, as long as 0.7390 is not broken, a further advance to 0.7460 and even to 0.7495 seems more likely to occur.
Strategy: BUY Stop Loss: 0.7390 Take Profit: 0.7460
Chart Explanation:
The black line shows the pivot point. Currently, the price is above the pivot point which indicates the bullish position. If it remains below the pivot point, it will indicate the short position. The red lines show the support levels and the green line indicates the resistance levels. These levels can be used to enter and exit trades.
Resistance levels: 0.7460, 0.7495, and 0.7525
Support levels: 0.7350, 0.7325, and 0.7300


